


Many Taiwanese feel that the Taiwanese economy recently has been a disaster: low and stagnating wage rates, increasing income inequality, the hollowing out of domestic industries, and languishing exports. The new government of President Tsai Ing-wen came to power in May this year facing economic contractions for the past three quarters and a sharp decrease in exports for 16 consecutive months. Taiwan’s exports are expected to fall continuously for the rest of 2016.
These trends are reflected in Taiwan’s economic growth. According to the Asian Development Outlook 2016, published by the Asian Development Bank in April 2016, Taiwan’s gross domestic product (GDP) in 2015 grew only 0.7 percent, down sharply from 3.9 percent growth in 2014. The 2016 growth forecast for Taiwan is only 1.1 percent, far behind estimates for neighboring countries South Korea (2.6 percent), Hong Kong (2.1 percent), and China (6.5 percent). As the Taiwanese economy depends heavily on its exports, especially on the Chinese market, considering increased competition from South Korea and Hong Kong along with China’s new policy of developing its own IT industries with heavy investment, the prospect of sustained growth for the Taiwanese economy is indeed bleak. It appears that the Taiwanese economy is sinking and that the “miracle growth” of the 1970s and the 1980s has run its course.
Amid this pessimistic outlook, however, when we look at the international data, and compare Taiwan’s economic performance with other countries, especially with some of the most advanced European countries, we find quite a different picture, as explained below.
PPP GDP Per Capita
Figure 1 shows the trend of GDP per capita measured by the purchasing power parity (PPP), denoted briefly as PPP GDPpc, for 11 countries of interest. We use PPP GDPpc since it measures the economic performance of a country as well as the living standards of the people in the country. It is also called GDPpc measured in international dollars (instead of U.S. dollars), and is a much better measurement for comparison of the GDPs among various countries. All the data in this article are downloaded from the IMF World Outlook dataset, which includes data from 1980 to 2014, and then forecasts GDPpc up to 2020.
Figure 1 compares PPP GDPpc for Japan, the United States, South Korea, Taiwan, Singapore, China, and India. We also traced PPP GDPpc for four advanced European economies: the United Kingdom, Germany, France, and the Netherlands. The Netherlands is included since its area is close to that of Taiwan and it has historical ties with Taiwan. The black column for 1997 shows the year of the 1997 Asian Financial Crisis and the black column at 2014 shows the end of the actual data; data from 2015 on are IMF projections. (Note: Japan is shown as a bar, rather than a line, to avoid clustering and make the chart easier to read).
Figure 1 shows that Taiwan’s PPP GDPpc surpassed that of Japan in 2007 (circled in yellow on the chart) and the difference between the two countries appears to be increasing over time. Taiwan’s PPP GDPpc caught up with that of Japan faster than we had expected based on our previous studies. South Korea’s PPP GDPpc, meanwhile, is still consistently below that of Taiwan (as it has been since the end of World War II), but is expected to surpass that of Japan in 2017 (also circled).
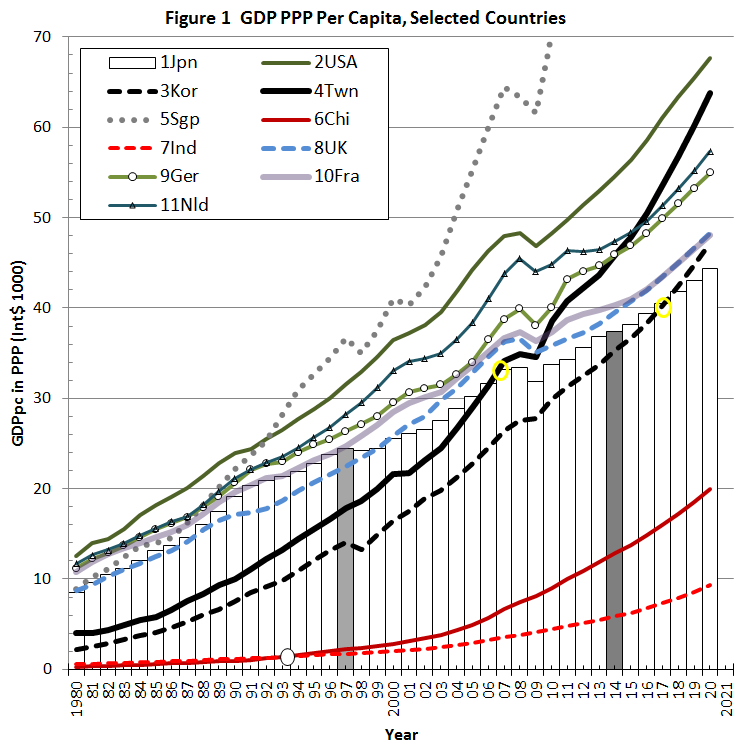
Figure 1 also shows that all four European countries have maintained more or less the same PPP GDPpc level and growth since the 1980s, forming a steady, upward moving narrow interval (or band) each year between the trend lines of the United States and South Korea. Contrary to some pessimistic views of the future of the world economy, these figures indicate solid economic performance by the advanced economies and a steady growth of the standard of living among the developed countries over the past three decades.
Compared with these European countries, Taiwanese economic performance in terms of PPP GDPpc level and growth appears to be especially outstanding. After building its potential during the 2000s, the PPP GDPpc of Taiwan not only caught up with Japan in 2007, it marched to catch up with that of the U.K. and France in 2010, of Germany in 2015, and is expected to catch up with that of the Netherlands in 2016. Taiwan’s PPP GDPpc level is even poised to converge on that of the U.S. after 2020! Note that high growth rates may induce a high inflation rate. However, this is not the case in Taiwan. During this period, Taiwan’s consumer price index (CPI) were very low. If we take 2006 price as the base, it increased from 66 in 1982 to only 107 in 2011 during this 29-year period.
Incidentally, the Korean performance is also impressive, although not as good as that of Taiwan. Its PPP GDPpc is expected to catch up with Japan’s in 2017 and the U.K. and France after 2020. Amid the world economic slump in recent years, the economic performances of Taiwan and South Korea are indeed stellar.
Despite all the talk and hype of high economic growth in China and India, both China and India are far below these countries, and the difference seems to have been increasing over time recently. China was slightly below India from 1980 to 1993, but surpassed India and gradually grew faster than India after 1994. However, from the trend of the lines, there is no indication that China can catch up with Taiwan any time soon.
Nominal GDP (USD) Per Capita
Since most people, even economists, feel that PPP GDP is hard to comprehend, international comparisons of GDP still use U.S. dollars to deflate the national GDP of each country to obtain a nominal GDP in U.S. dollars. Thus, we also show the comparison in nominal GDP per capita measured in U.S. dollars..
Figure 2 shows nominal GDPpc in U.S. dollars of the same eleven countries shown in Figure 1. Unlike its counterpart in Figure 1, these lines have much more fluctuation. Note that the PPP index measures the long-run trend (through the one price rule); thus, the trend line of PPP GDPpc for all countries in Figure 1 is much smoother than that of nominal GDPpc of these countries in Figure 2.
In a sharp contrast to Figure 1, South Korea came closer to Taiwan after 1980, eventually caught up with Taiwan in 2003, and is expected to maintain the same distance over Taiwan after 2014. According to the IMF prediction, South Korea is even expected to surpass Japan in 2020. Japan surpassed the United States from 1987 until 2000, and then fell behind the U.S. again after 2001, with a widening gap. For the four European countries, there are recessions in the early 2000s and the early 2010s, but their economies recovered quickly and continued to grow. However, the recent U.K. decision on leaving the European Union (Brexit) cast a long shadow on their future growth.
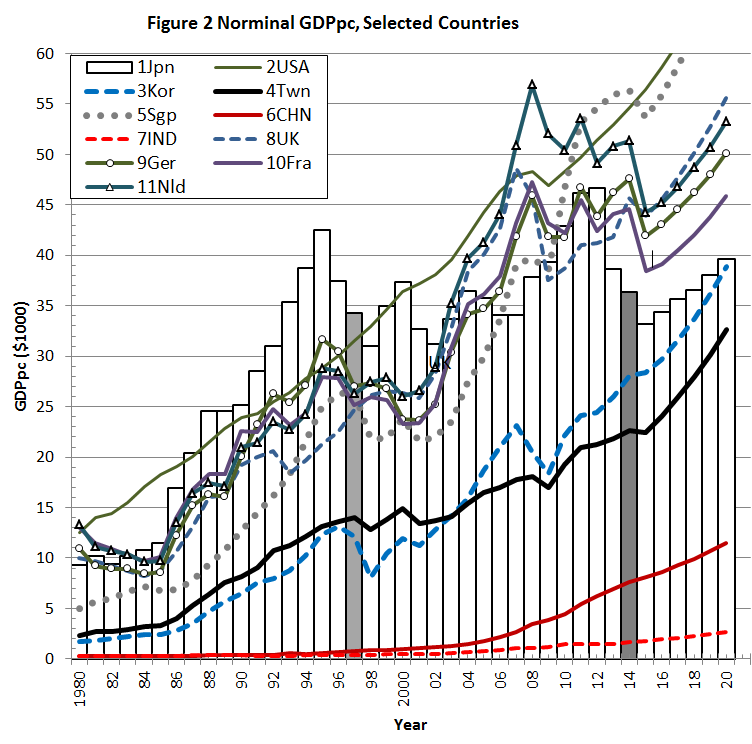
In contrast, Taiwan, and to a lesser degree Korea, is expected to grow steadily. Like Figure 1, both China and India remain far behind all the countries in the chart, and, unlike Figure 1, there is no indication that India is catching up with China, nor that both countries are catching up with any of the other countries in the figure. In particular, like Figure 1, there is no indication that China will catch up with Taiwan even in terms of nominal GDPpc anytime soon, and it may never catch up with Taiwan.
We see that the results of PPP GDPpc and nominal GDPpc in U.S. dollars are quite different for Taiwan, especially in comparison with South Korea. However, if we consider that the GDP of a country consists of consumption, investment, government expenditure, and net exports (exports minus imports), measuring a country’s GDP by U.S. dollars is only appropriate for internationally traded goods (exports and imports), and will distort the measurement of other GDP components, most of which are not internationally traded. On the other hand, PPP GDP uses different prices to deflate different GDP components, and is considered to be a better measurement for international comparisons. Thus, PPP GDPpc is a more reliable measure and we can take the results of PPP GDPpc in Figure 1 at face value.
PPP GDPpc Growth Rates
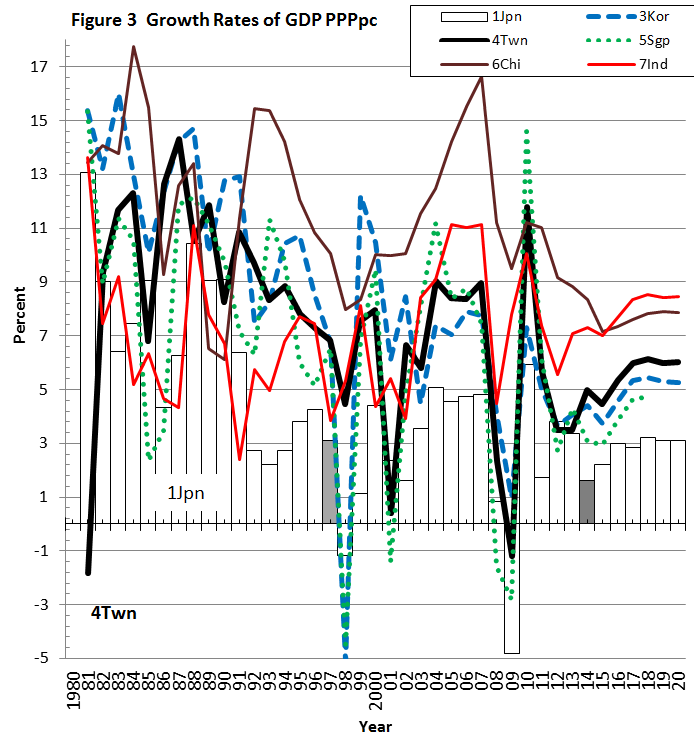
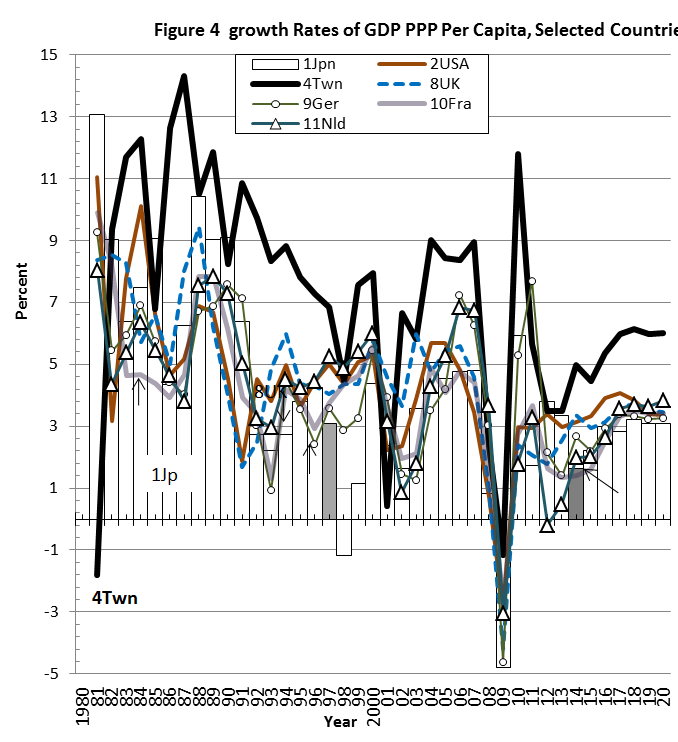
Most economic prediction is done by using the growth rate of an economic variable, instead of the level of the variables (as used in the previous two charts). Growth rates reveal more information about the changes of an economy over the years. Thus, we show the growth rates of the PPP GDPpc in Figures 3 and 4. Figure 3 compares Taiwan and Japan with the four other Asian countries, and Figure 4 compares Taiwan and Japan with the United States and four advanced European countries.
In terms of growth rates, unlike the previous figures, both figures show clearly that the PPP GDPpc of all 11 countries was affected by the 1997 Asian financial crisis and also the 2008 world financial crisis. During the 1997 crisis, the impact was felt especially severely in the following year, 1998, on South Korea (-5.1 percent growth), Singapore (-4.5 percent), and Japan (-1.2 percent), but Taiwan maintained healthy 4.4 percent growth (see Figure 3). During the second recession, all countries experienced negative PPP GDPpc growth rates in 2009 (ranging from -4.8 percent to -1.2 percent) except India and China. However, the impact on Taiwan was the least, at -1.2 percent. We may see from both figures the resilience and sustainability of the Taiwanese economy during international financial crises.
The reason for Taiwan’s negative growth rate (-1.8 percent) during the years 1980 to 1981 is not clear and calls for further study. If we take this as an outlier and consider the growth rates of other years, we see a general declining trend of the PPP GDPpc growth rate of the Taiwanese economy from the period of 1982 to 2001, during which it reached the highest rate of 14.2 percent in 1987, but continued to decline to mere 0.4 percent in 2001. It then rebounded up to 9 percent in 2004 and again in 2007, but declined to -1.2 percent in 2009. This is apparently mainly due to the world recession, as all other countries’ GDPpc growth rates in the figure also dipped in that year. Afterward, although the growth rate shot up to 11 percent in the next year (2010), it declined precipitately to 3.5 percent in 2012 and 2013, and rebounded only slightly to 4 to 5 percent thereafter.
Compared with other countries of interest, the trend of PPP GDPpc growth rates for Taiwan in Figures 3 and 4 is that the Taiwanese economy closely follows the general world economic trend, especially the economic trends of the European countries. This is expected since the Taiwanese economy is an open economy, relying heavily on its exports. Figure 3 also shows that Taiwan’s growth rates since 2000 are generally lower than those of China and India up to 2014, and projected to be lower up to 2020. Figure 4 shows, like Figure 1, the PPP GDPpc growth rates of the four European countries move together very closely, and that of Taiwan is uniformly higher than that of Japan and four advanced European countries, and projected to be so until 2020. It also indicates Taiwan’s high economic performance over the advanced European countries.
Here we made some calculations. Note that the 2014 actual growth rate of Taiwan, China, and India was 5.0 percent, 8.4 percent, and 7.3 percent, respectively (see Figure 3), and the corresponding PPP GDPpc in 2014 was $45,854, $12,880, and $5,855, respectively (see Figure 1). According to the IMF calculations, the expected average growth rate of these three countries from 2015 to 2020 will be 5.7 percent, 7.6 percent, and 8.1 percent, respectively. We have found that, using the 2014 level of PPP GDPpc as a base, whether we use actual growth rates or expected growth rates, China and India will never be able to catch up with Taiwan; the difference in PPP GDPpc among them are simply too large, as shown in Figure 1.
Conclusion
Before the Taiwanese presidential election this year, there was a debate comparing economic growth under President Chen Shui-bian of the DPP government from 2000 to 2007 and under President Ma Ying-jeou of the KMT government from 2008 to 2015. Our calculations show that the average annual PPP GDPpc growth rate from 2000 to 2007 was 6.9 percent while that from 2008 to 2015 was a lackluster 4.4 percent. It appears that Ma’s “cross-Strait peace dividends” did not benefit the general public but a few big businesses. The lack of improvement in economic performance and standards of living, or rather, broken promises of economic reform, had an important impact on the result of the recent presidential election, ensuing regime change. This being said, from Figures 3 and 4, considering the expected slow economic outlook for Taiwan and the world, the new DPP government of Tsai Ing-wen indeed faces a formidable task in reversing the declining economic growth and improving Taiwan’s economic performance and standard of living.
It should be noted that GDPpc is only one of the measures of economic performance and standards of living, although it is the most important one. For a more detailed analysis, we need to disaggregate the components of GDP and compare the performance of each component, along with the trends of financial indicators, and compare internationally. However, our figures did show that, at least up to now, the Taiwanese economy is not only doing well, but exceptionally well, as compared with other nations.
In fact, we submit that excellent performance of the Taiwanese economy up to now is simply a reflection or even vindication of the overall generally high ratings of the Taiwanese economic and business performance over many years, manifested in the Global Competitiveness Index (GCI) of the World Economic Forum (WEF), the World Competitiveness Index (WCI) of the International Institute for Management Development (IMD), and Doing Business Annual Report of the World Bank. In short, Taiwan’s economic fundamentals are still sound and viable. Thus, despite all the difficulties and setbacks mentioned at the beginning of this writing, the Taiwanese should have confidence in their ability to achieve faster economic growth and be aware of their important position in the world economy. Barring unforeseen political disturbances and economic disaster, we may expect that the Taiwanese economy will continue to grow and surpass other developed countries.
Frank S.T. Hsiao is Professor Emeritus of Economics, University of Colorado, Boulder, Colorado, U.S., and member of the North America Taiwanese Professors’ Association. Figures 1 and 2 are an expanded version of two figures in Chapter 9 of the forthcoming book, Frank S.T. Hsiao and Mei-Chu Wang Hsiao, Economic Development of Emerging East Asia-Catching Up and Convergence, London: Anthem Press.