India conducted its first successful anti-satellite (ASAT) test, dubbed “Mission Shakti,” on March 27, 2019. Using a so-called PDV Mark II missile, a modified version of India’s Prithvi Defense Vehicle (PDV) anti-ballistic-missile interceptor, India’s Defense Research and Development Organization (DRDO) destroyed the Microsat-r satellite orbiting at 285 kilometers in altitude. Microsat-r (COSPAR designation 2019-006A) was a 740 kilogram satellite launched by India two months earlier to serve as a target for the test.
In the aftermath of the test, accusations quickly emerged — including from NASA administrator Jim Bridenstine — that the debris generated by the test endangered other satellites. India was quick to claim it had acted “responsibly.” The Indian government pointed out that the test was performed at low altitude, below 300 km, in order to avoid creating debris at the altitudes of operational satellites in Low Earth Orbit (many of which orbit at altitudes between 400 and 1200 km).
In a press conference, DRDO chairman Dr. Sateesh Reddy, in addition, claimed that the kill-vehicle hit Microsat-r in what he described as an “almost direct hit in the same plane,” i.e. head-on. This was done — or so it was claimed — in order to minimize the ejection of debris fragments into higher orbits. The Indian government maintains that the test yielded a negligible risk to operational satellites at higher altitudes. It has claimed that most debris fragments re-entered into the Earth’s atmosphere within two days of the test, and that all of it would re-enter within 45 days.
But are these Indian government claims true? An in-depth analysis of publicly available data from both DRDO and U.S. military sources shows that this test wasn’t conducted as “responsibly” as the Indian government claims. Debris did end up orbiting at higher altitudes well within the altitude range of operational satellites, including the International Space Station (ISS). The debris fragments currently being tracked by the U.S. military’s tracking network will take considerably more than 45 days to re-enter into the atmosphere. Moreover, telemetry data included in a video released by the Indian DRDO indicates that the kill vehicle did not hit the target satellite head-on as the DRDO claims, but under a clear upwards angle, which would eject fragments to higher orbits.
The Timing of the ASAT Test
From information released by the DRDO, we know that the PDV-Mk II missile was launched from the missile test range at Abdul Kalam island (formerly known as Wheeler island) on the Indian coast around 11:09 a.m. Indian Standard Time (5:39 a.m. GMT). This time was independently confirmed by U.S. military sources, likely based on observations by their space-based infrared system (SBIRS) early warning satellites. Indian sources say the missile had a flight-time of 168 seconds. From a video released by DRDO showing the kill vehicle’s impact into Microsat-r as imaged by an earth-based infrared camera on the Indian coast, we can pinpoint the intercept time at 5:42:15.5 GMT. This would place the launch as having taken place around 5:39:27 GMT. The orbital position of the target satellite at 5:42:15.5 GMT, the moment of intercept, was within a kilometer of 18°.715 N, 87°.450 E at an altitude of 284 km.
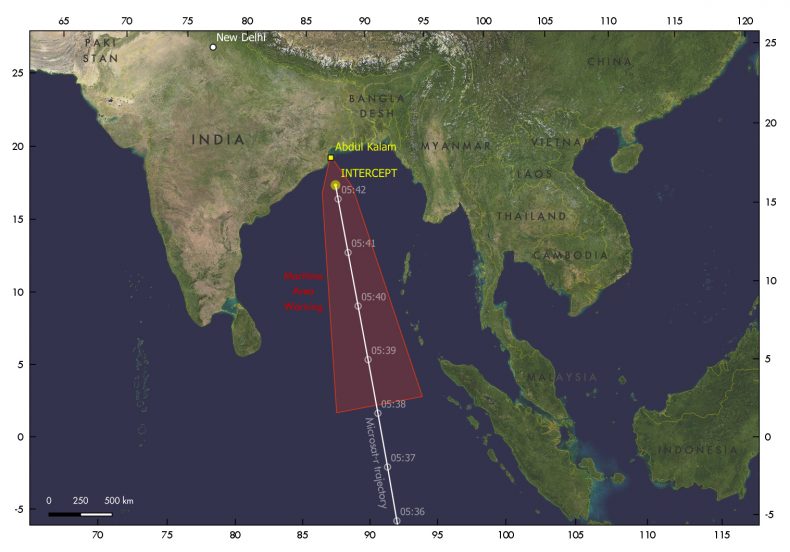
Fig. 1: map showing the approach trajectory of the target satellite (white), the missile launch site and intercept location (yellow), and the hazard area for the test (red) from a Maritime Area Warning. Map by the author.
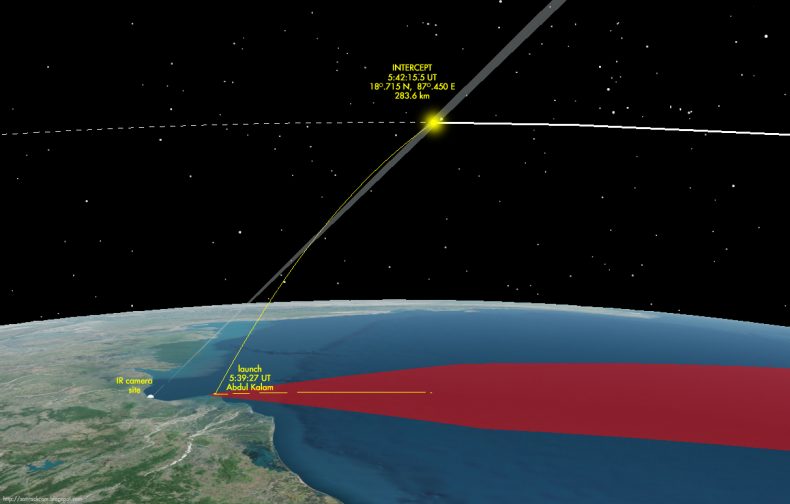
Fig. 2: 3D reconstruction of the approximate intercept geometry, created by the author using STK. This reconstruction modelled a direct ballistic ascent.
An OSINT Treasure Trove
Shortly after the test, DRDO released a propaganda video that contains two highly interesting fragments of video footage from the actual test. One is a short sequence of images from the infrared target seeking camera on the missile itself. The other is a sequence of footage taken by an earth-based infrared camera on the Indian coast.
It is the latter footage that contains a lot of information useful for the purpose of this analysis and is, in fact, an OSINT treasure trove. A clock running in the footage yields an accurate time of the kill vehicle impact. But more importantly, the footage appears to contain telemetry information from the missile: azimuth (direction), elevation, and range (distance) to the camera. The footage covers the last 2.7 seconds of the missile’s flight up to impact, and some 2 seconds after the impact as well, showing the expanding debris cloud.
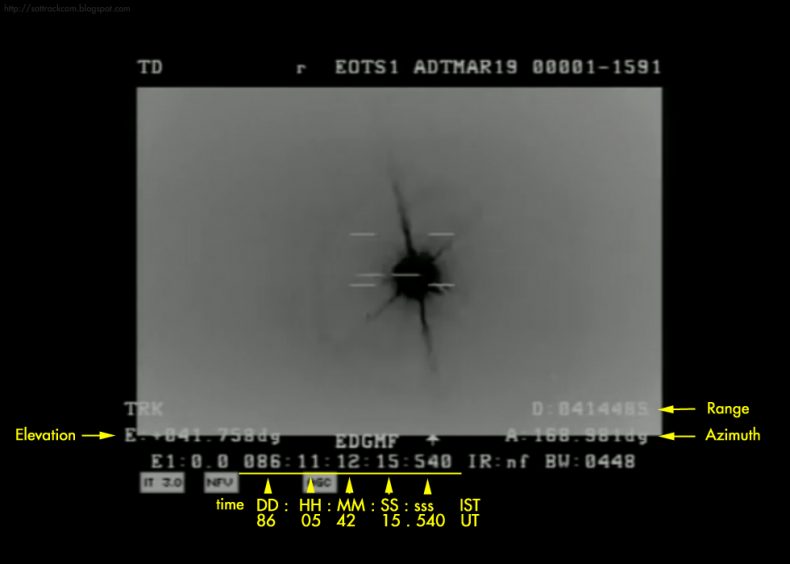
Fig 3: still frame from DRDO released video footage of the intercept, as captured by an infrared camera on the Indian coast. Yellow annotations indicate missile telemetry data in the video frame.
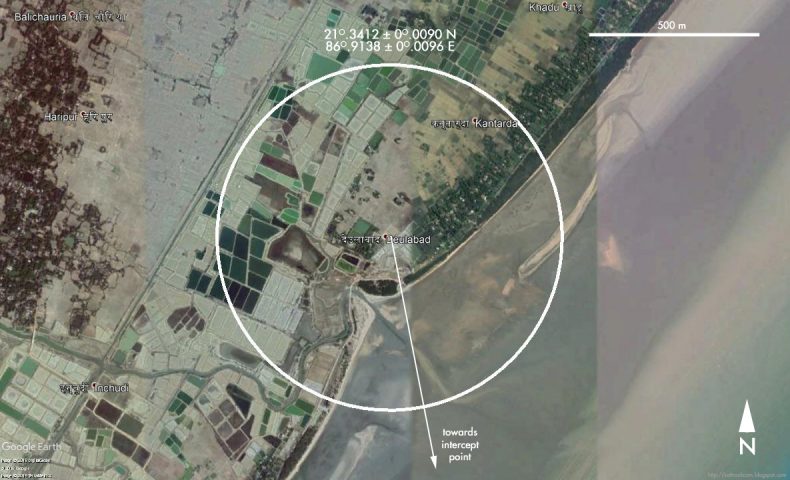
Based on U.S. tracking data from U.S. Strategic Command’s Combined Space Operations Center (CSpSOC), we know the position of Microsat-r, the target satellite, at the time of impact. We therefore can use the missile’s azimuth, elevation, and range information in the video frame showing the impact moment to find the location of the earth-based camera. This camera was located on the Indian coast near 21°.34 N, 86°.91 E, some 15 km southwest of Chandipur ITR. This location is near the point where the forward prolonged trajectory of the target satellite crossed the Indian coast. As the satellite position has an approximately 1 km uncertainty inherent to orbital elements in CSpOC’s two-line element (TLE) set format, there is a similar uncertainty in the camera location.
Knowing the camera location, we can next use the telemetry data in the frames to reconstruct the trajectory of the missile during the last 2.7 seconds prior to impact with Microsat-r, and compare it to the trajectory of Microsat-r itself.
In order to do this, we can create a flat plane through the camera sensor, tangent to the earth surface at the camera location. Azimuth, elevation and range data from the footage then give us Cartesian positions and elevations with respect to this reference plane. In this way, we don’t have to be bothered by the earth’s curvature, and it greatly simplifies calculations. We are only interested in the relative geometry of the satellite and missile tracks, so this approach is sufficient.
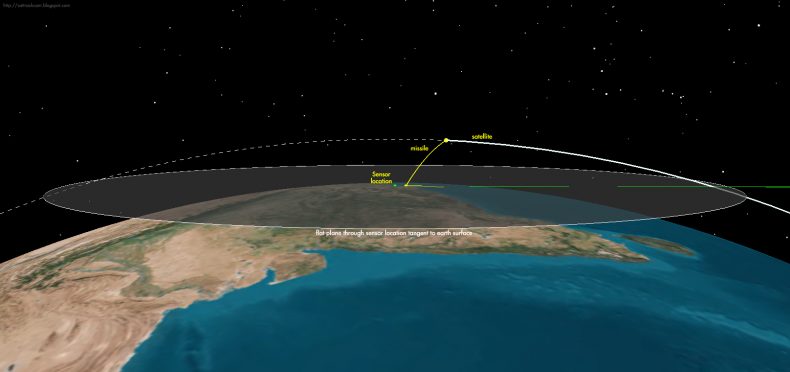
Fig 5: graphical representation of the reference frame used, a flat plane through the sensor location tangent to the earth surface.
In the diagrams that follow, positions are expressed as delta X and delta Y (in km) in the reference plane with respect to the camera location, and altitude over the reference plane (note: this is not the same as the altitude above the earth’s surface). The Y-axis points north, the X-axis east. As we had to work with limited resolution frames extracted from a YouTube video, occasional errors in deciphering the telemetry numbers cause some small occasional jitters in the reconstructed missile trajectory. Nevertheless, the results are very consistent.
The first diagram shows the missile and satellite trajectories when viewed top-down (i.e. “from above”): black is the missile and red the satellite. The solid lines give the trajectories up to the moment of impact, the dashed lines give post-impact trajectories. The approximately 1 km positional error in the satellite’s trajectory is indicated in grey.
Seen from this perspective, the hit appears to be almost head-on, with the missile first crossing the satellite trajectory from the east and then impacting while homing in slightly from the west, relative to the satellite’s movement vector. The latter is, as we will see, in keeping with two other lines of evidence.
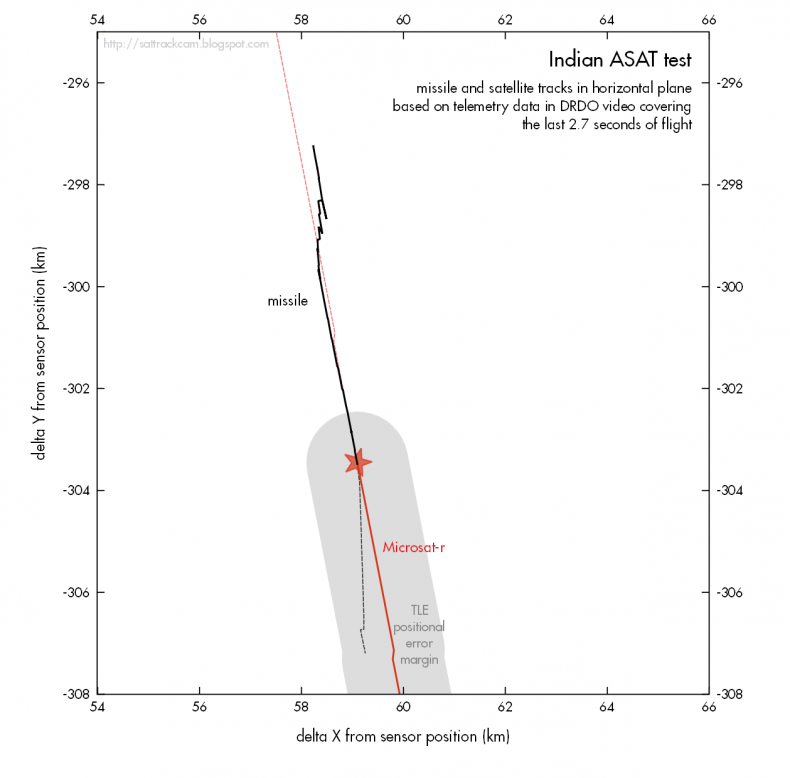
Fig 6: missile trajectory in the horizontal plane, reconstructed from telemetry data in the DRDO video.
When we look at the missile trajectory from a vertical perspective, i.e. “from the side”, the situation looks quite different, with interesting implications. It becomes clear that, far from hitting “head-on,” the missile hit with a clear upwards angle of approximately 48 degrees with the horizontal (or 135 degrees with respect to the satellite’s direction of movement).
This runs counter to DRDO chairman Sateesh Reddy’s assertion of a “head-on” hit designed to reduce the risk of debris being ejected into higher orbits. An impact coming from below increases the risk of fragments being ejected to altitudes above the target satellite’s original orbit.
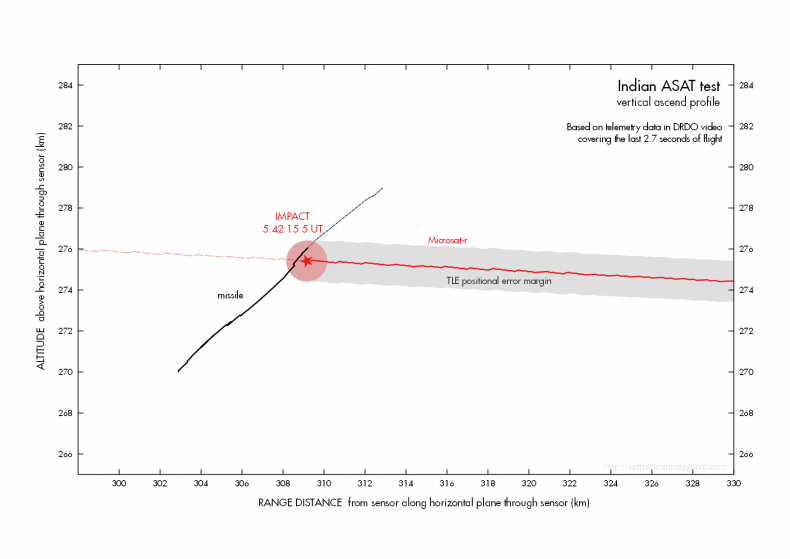
Fig 7: missile trajectory in the vertical plane, reconstructed from telemetry data in the DRDO video.
A second line of evidence — footage from the infrared target seeking camera on the missile itself — also indicates a hit coming from below, in an upwards direction. The last frames of this footage show the infrared silhouette of the satellite, including its solar panels. They appear to show the latter full-on:
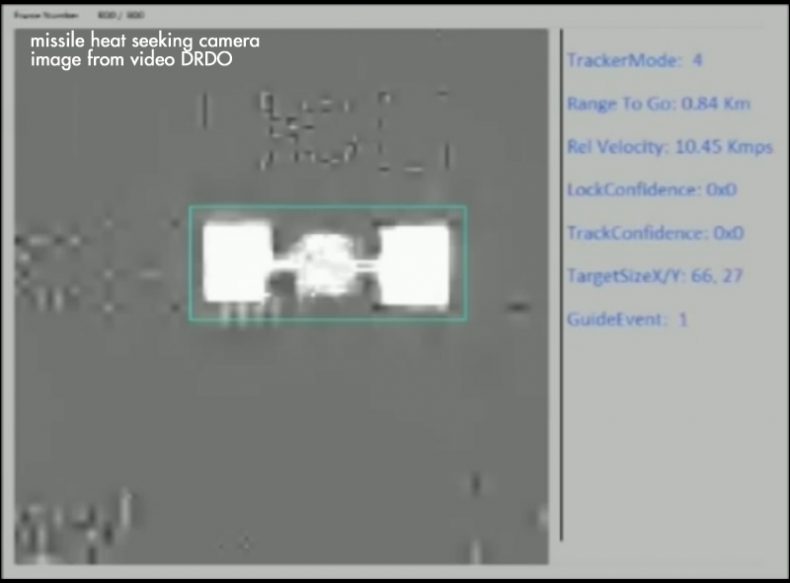
Fig 8: final image of the target seeking camera on the missile, showing the solar panels of the target satellite, from the DRDO video.
Would the impact have been “head-on,” i.e. moving into a direction opposite to the satellite’s movement vector, the solar panels should not have been visible full-on, but edge-on, given the sun-satellite-missile geometry at that moment. Solar panels are normally pointed toward the sun. A hit under an upwards angle, by contrast, would show the solar panels almost head-on, as in the footage. Hence, like the earth-based footage, the footage from the missile target seeking camera contradicts a “head-on” hit. These two lines of evidence are therefore consistent, supporting the same conclusion: that DRDO’s claims about the nature of the intercept were not entirely true.
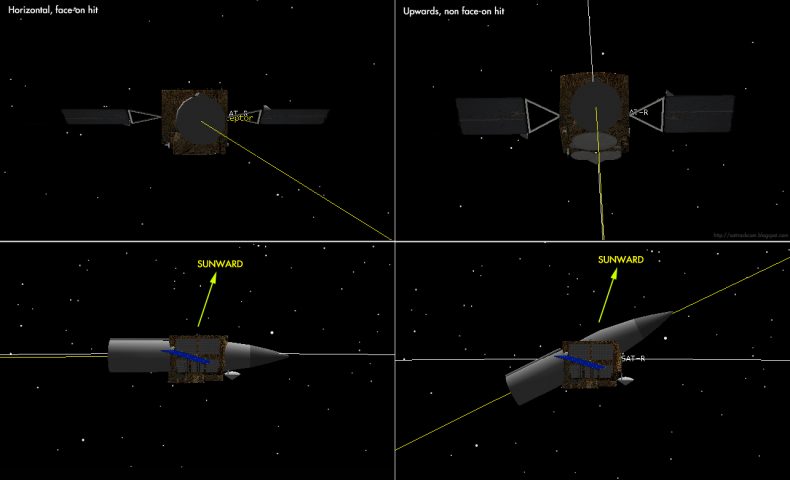
Fig 9: Geometry reconstructions for two intercept scenarios by the author, using STK. One shows a “head-on”hit, the other a hit coming under an upwards angle from below. Note the differing views of the solar panels in both scenarios.
Interestingly enough, and perhaps unintentionally telling, the DRDO propaganda video has an animation of the intercept that at one point also features a steep upwards angle, consistent with a direct ballistic ascent.
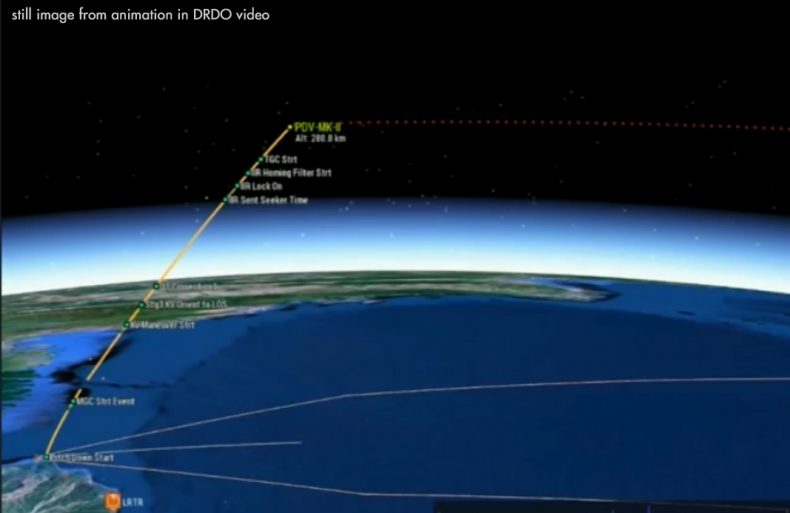
Fig 10: Still image from DRDO video showing a graphical depiction of the missile trajectory. Compare to the author’s reconstruction.
Expanding Debris Cloud
After the kill vehicle hit the satellite, an expanding debris cloud was created that quickly spread. Knowing the position of the camera, we can actually plot the trajectory of the target satellite on the infrared imagery of this rapidly expanding debris cloud. We see the cloud expanding along the satellite track, notably in a forward direction (which is logical, as with an impact coming from below, the forward momentum from the 7.8 km/s moving satellite is the largest contributor to debris fragment speed vectors).
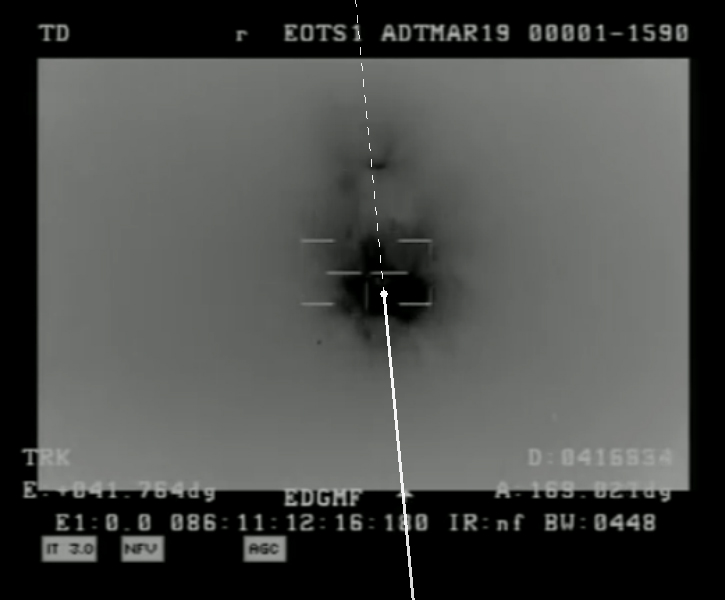
Fig 11: satellite trajectory as seen from the camera location, as overlaid on a frame from the DRDO video showing the expanding debris cloud. Satellite movement was from bottom to top.
Relative Speed of Impact
From the telemetry-based trajectory reconstruction, the missile reached a speed on the order of 3.1 to 3.4 km/s. Taking into account the 7.8 km/s orbital speed of the satellite, as well as the directions of their movement vectors, a relative speed in the order of 9.9-10.0 km/s on impact is indicated. This is close to the 9.8 km/s value given by U.S. military sources. It is less than the relative speed indicated in the missile’s target seeking camera footage (10.45 km/s).
Post-Impact Trajectory
Interestingly enough, the footage also includes two seconds of missile telemetry after the impact, suggesting part of the missile survived the impact. This post-impact trajectory is indicated by the dashed line in the trajectory reconstructions. In the vertical plane, we see the missile rip through the position of the satellite, the missile remnant continuing its upwards movement, perhaps under a slightly reduced angle. In the horizontal plane (i.e. seen from “above”) we see the missile remnant being clearly deflected westwards by the force of the impact, pretty much like a billiards ball hitting another ball under an oblique angle. This indicates a hit which, seen in the horizontal plane, came under a slight angle with the satellite’s movement vector. This matches information gleaned from tracked debris fragments, as I will outline below.
Debris Fragments Created
The U.S. military’s satellite tracking network, run by CSpOC, has reported it is tracking several hundreds of debris fragments created by the test. At the date of writing, CSpOC has published orbital elements for 84 of these fragments. As these 84 fragments concerns a subset of larger, well tracked fragments out of a much larger not-well or not-at-all tracked fragment population only, these orbits constitute the tip of an iceberg. The orbital elements illustrate the large spread in orbital altitudes of the debris fragments created by the test. The image below shows the orbits of these fragments (red), with the orbit of the ISS (white) shown as comparison:
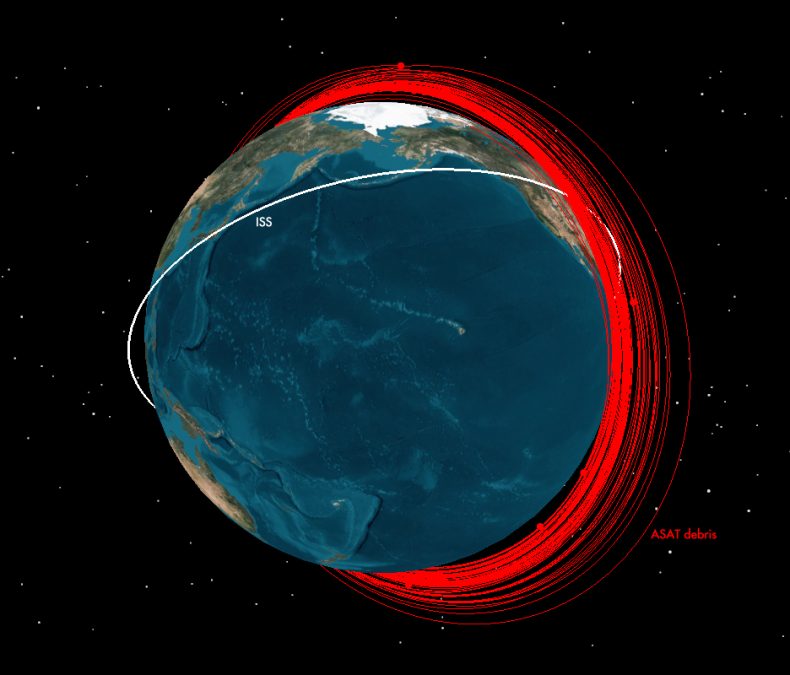
Fig 12: orbits of debris fragments (red), with the orbit of the International Space Station (white) as a comparison.
One insightful way to present the orbital altitudes of these fragments and assess these at a glance is through a so-called “Gabbard” diagram. Such a diagram shows, for each fragment, the lowest point in its elliptical orbit (its perigee, in red) and the highest point in its orbit (its apogee, blue), as well as the time it takes to complete one orbit around the earth.
While the perigees of the debris fragments are distributed near the altitude of the ASAT test (285 km), the apogees spread over a large range in altitude, up to as high as 2,250 km. Some 79 percent of the tracked fragments have apogee altitudes above the orbital altitude of the International Space Station. The strongest concentration is between 200 km and 900 km altitude (see also the bar diagram), well into the realm of the orbital altitudes of many commercial as well as scientific and military satellites. Hence, these fragments clearly are an impact-threat to other satellites, in contrast to Indian government claims of minimal risks. Close approach tools like SOCRATES show that several debris fragments already have had close approaches to other satellites since the test, and that such potentially dangerous close approaches will continue to happen over the coming weeks and months.
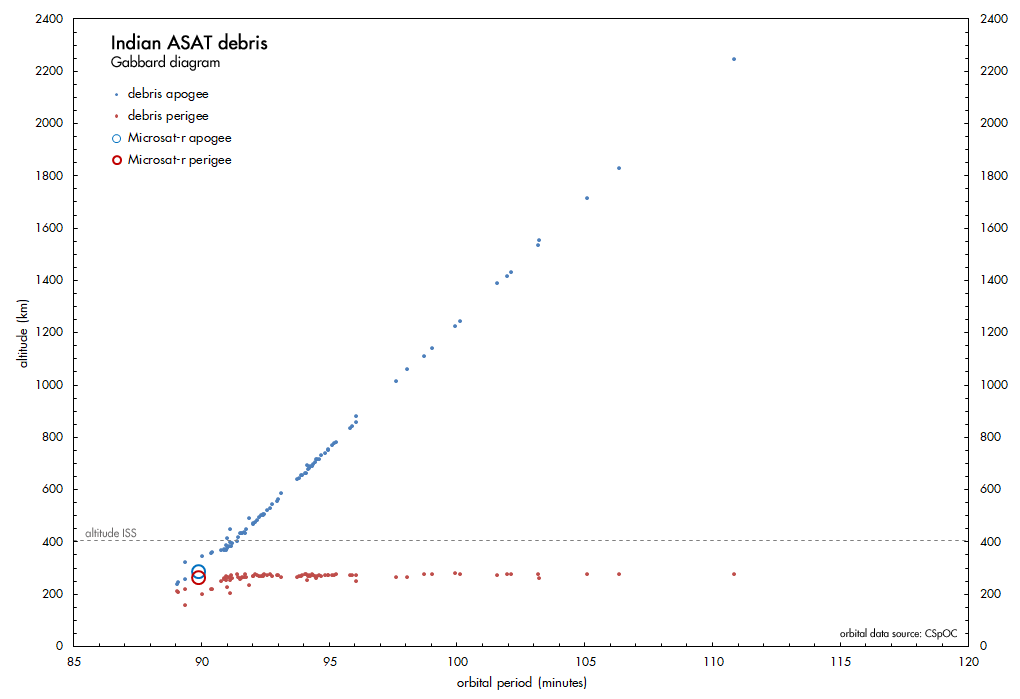
Fig 13: Gabbard diagram showing apogee and perigee altitudes of debris fragments. ISS orbital altitude indicated as comparison.
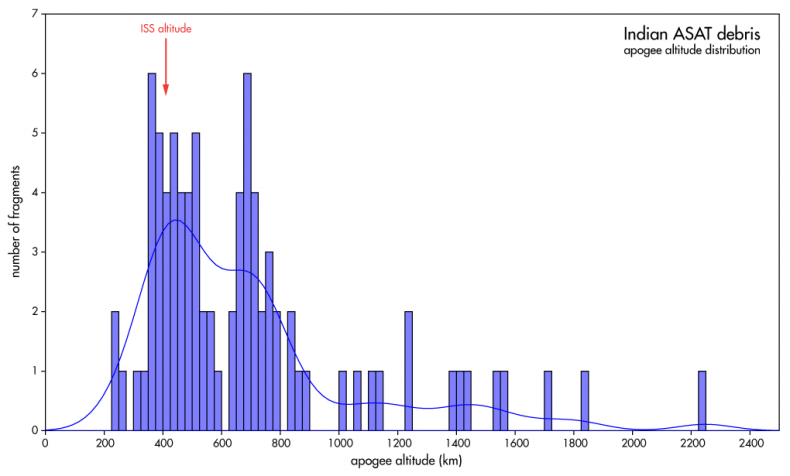
Fig 14: bar diagram of the distribution of debris fragment apogee altitudes. ISS orbital altitude indicated as comparison.
These results should not come as a surprise, to India or anyone else. In 2008, the United States conducted “Operation Burnt Frost,” an ASAT demonstration on the malfunctioned USA 193 satellite. That intercept, like the Indian ASAT test, was at low altitude (247 km), but a significant number of fragments nevertheless ended up in much higher orbits.
Orbital Lifetimes of the Fragments
How long will it take before most of the debris created by the Indian ASAT test is cleared from orbit? The Indian government claims most fragments re-entered within hours to days, and that the rest will re-enter within 45 days of the test.
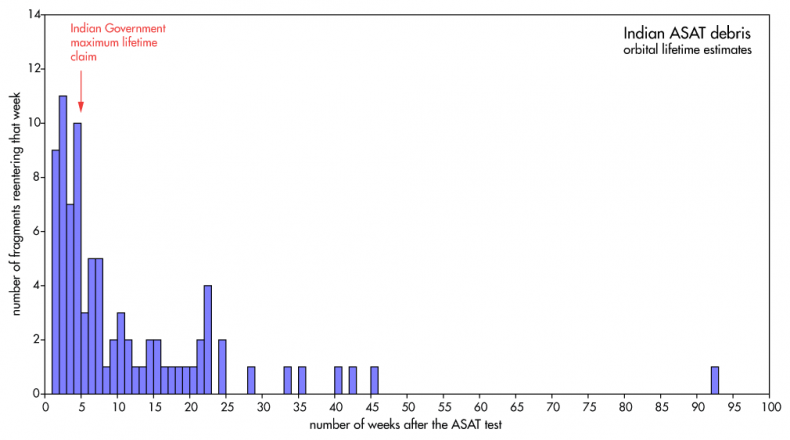
The vast majority of very small fragments created by the ASAT test will likely indeed have re-entered within hours to days of the test. But as we already have seen, there are still plenty that did not. For these, we can estimate orbital lifetimes from the decay parameters of their orbits and an educated guess of future solar activity (solar activity influences the density of the outer layers of the atmosphere). I used SatEvo software and current solar activity values to estimate the re-entry dates of the currently tracked fragments. It suggests that a significant number — almost 50 percent — of the tracked fragments have orbital lifetimes well beyond the 45 days claimed by the Indian government, as the diagram below clearly shows. Rather than 45 days, a better estimate for the maximum debris lifetime would be 45 weeks. Some fragments might even linger on until almost two years after the test.
Ejection Velocities
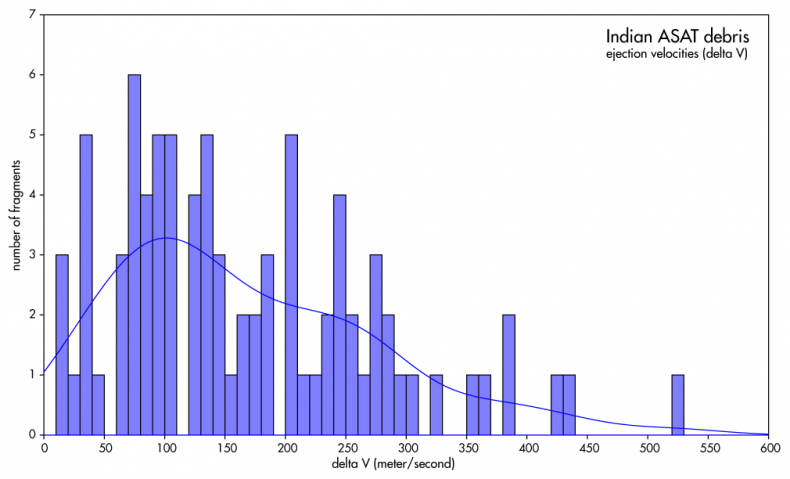
The orbital data for the 84 debris fragments tracked by CSpOC can be used to calculate the ejection velocities of these fragments. The ejection velocity, or delta V, is the extra velocity that was required to eject these fragments into their current orbits, and can be calculated from the change in orbital altitude and orbital inclination for each fragment. For the 84 fragments for which orbital elements are currently available, I calculate ejection velocities in the range of 10 to 300 meter/second, with a few having ejection speeds up to 500 meter/second. The range of ejection velocities is similar to that of the 2008 ASAT demonstration on USA 193 by the Americans. The peak in the delta V distribution of the Indian ASAT test is, however, shifted toward higher ejection velocities compared to the 2008 American ASAT demonstration: the distribution peaks near 100 m/s, while for the 2008 USA 193 intercept it peaks near 40 m/s. On average, the ejection speeds in the Indian ASAT test hence appear to have been somewhat higher than in the 2008 American test, creating peak debris densities at somewhat higher altitudes as a result. The difference might result from a difference in impact angle: the American ASAT test reportedly featured an impact on a downward angle, while the Indian test featured an upwards impact angle, as the above analysis shows. Some caution is in order here, though, as instrumental detection bias might have an unknown influence on the range of orbital altitudes mapped so far.
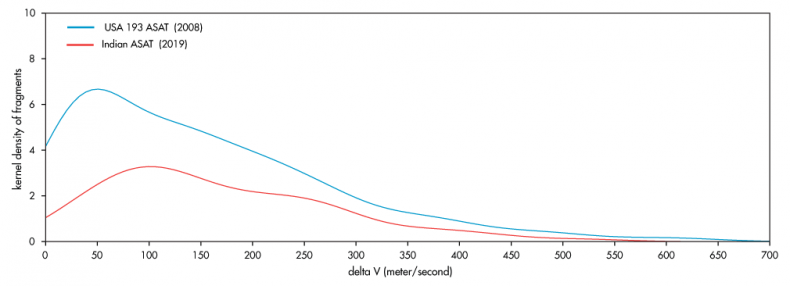
Fig 17: delta V distribution kernel density curves for the Indian ASAT test fragments, compared to a similar curve for the 2008 American ASAT demonstration on USA 193. Note the difference in peak position and fall-off slope.
Orbital Inclinations
As seen in a horizontal plane (i.e. from “above”), the kill vehicle was not exactly moving counter to the satellite, but under a very slight angle, with the kill vehicle coming slightly from the west with regard to the satellite’s movement vector. The clear westward deflection of the missile remnant after the impact, also points to this.
This hit under a small angle from the west is also born out by the orbits of the resulting debris fragments. The distribution of orbital inclinations of these fragments (the angle their orbits make with the equator) shows a shift towards smaller inclinations, by 0.5 degrees or more, compared to the original Microsat-r orbit. This again points to an impact coming from slightly west of the satellite’s vector of movement.
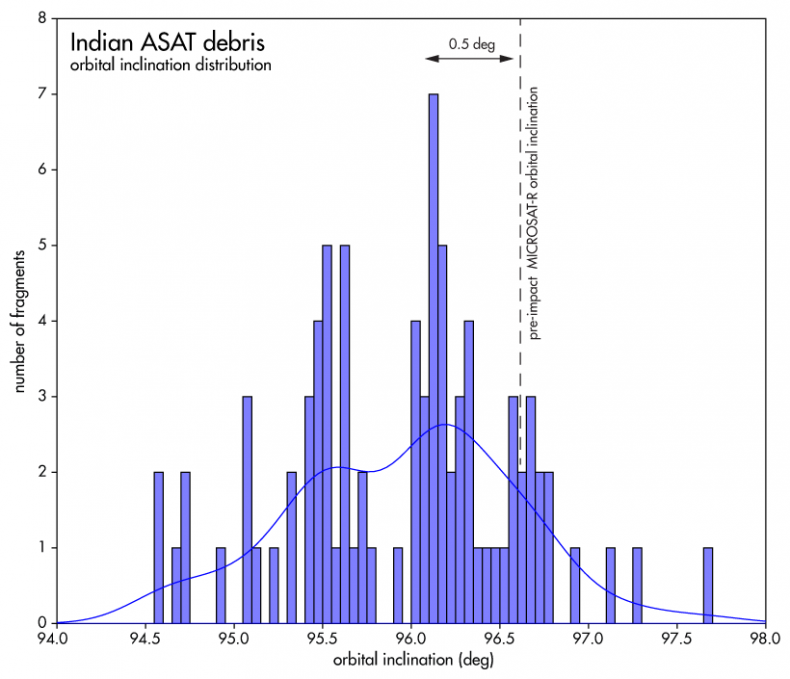
Fig 18: distribution of orbital inclination of the debris fragments, compared to the orbital inclination of the target satellite Microsat-r.
Conclusions
We can draw a number of conclusions from this analysis. The main conclusion is that the ASAT test was conducted in a less responsible way than originally claimed by the Indian government. First, the missile hit the target satellite on a clear upwards angle, rather than “head-on” as claimed by DRDO. Second and third, the test generated debris with much longer orbital lifetimes (up to 10 times longer), which ended up at much higher altitudes than the Indian government is willing to admit.
As much as 79 percent of the larger debris fragments tracked have apogee altitudes at or above the orbit of the International Space Station. Most of the tracked debris generated by the test orbits between 300 km and 900 km altitude, well into the range of typical orbital altitudes for satellites in Low Earth Orbit. As these debris fragments are in polar orbits, they are a potential threat to satellites in all orbital inclinations at these altitudes. Indeed, several close approaches to satellites have already happened. This threat will persist for up to half a year (rather than the 45 days claimed by the Indian government), with a few fragments lingering on (much) longer, up to almost two years.
The analysis underlines that a ‘harmless’ ASAT test involving a real intercept of an orbiting target does not exist. The Indian ASAT test and the earlier 2008 American ASAT demonstration show that even intercepts at low altitude create lots of debris that is ejected into higher orbits. And the Indian government in this case made it worse by hitting Microsat-r under an upwards angle, rather than head-on or under a downward angle. As such, this ASAT test was reckless.
Dr. Marco Langbroek is a Space Situational Awareness consultant from the Netherlands.


