


")


Information about economic activity is a key ingredient for policymaking and business decisions. However, official statistics in China have long been criticized for lack of transparency, data collection problems at the grassroots level, and frequent data manipulation. The inadequacy and insufficiency of official statistics have created a desperate need for alternative data. In an attempt to meet the market demand for data, investment banks, academic researchers, and media have raced to deliver their own estimates on various aspects of the Chinese economy (the banking and financial system, real estate markets, consumer markets, etc.). However the recent advent of new technologies can be a game-changer for the industry. It has created new opportunities for data collection in China and produced a plethora of indicators that are capable of satisfying the growing demand for quantitative measures of economic activity.
The Spread of Internet Use in China Is Leading to New Data Sources
China’s internet user base is huge and constantly growing. According to a recent report from the China Internet Network Information Centre (CNNIC), the number of internet users in China amounted to 829 million at the end of 2018, with a penetration rate close to 60 percent. The report highlights other interesting figures on how the internet is becoming increasingly integrated into the everyday life of Chinese citizens. According to CNNIC data, more than 70 percent of the total number of Chinese people on the internet are shopping and paying online.
These figures once again indicate the recent rise of internet, during which Chinese giant tech companies have become a vital part of the national economy. Consumers refer to search engines like Baidu or Sogou as the main way to find information about products and research purchase opportunities. They visit online shopping portals such as Alibaba and JD.com and actively use online payment services in everyday life, while online recruitment platforms provide an easy access to information about job offerings.
A penetration rate close to 60 percent indicates that China’s internet population represents quite a huge share of the Chinese consumer market in general. This means that the vast amount of data gathered and processed by internet companies can be used to measure economic activity in a completely new way. First of all, estimates can be produced much faster than official statistics, as raw data is already available for researchers in digital form. Second, new data sources can cover areas of economic activity that are poorly represented in official statistics (for example e-commerce or online payments).
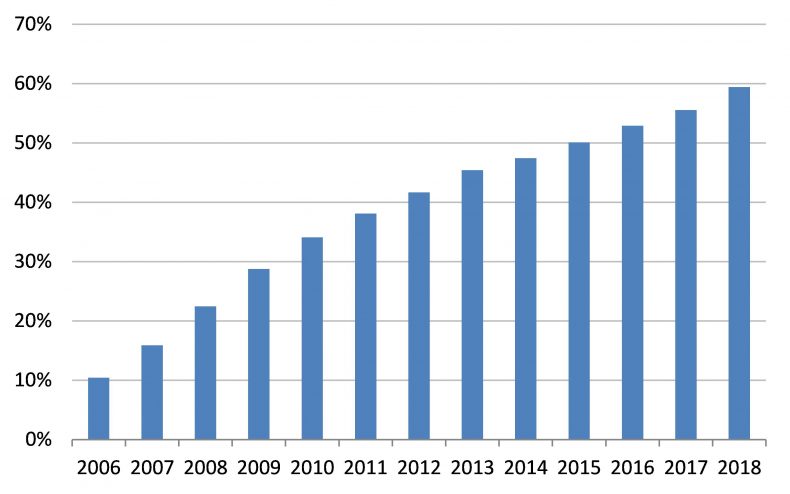
Figure 1: Internet users in China from 2006 to 2018 as percent of total population size.
Internet Queries and Social Media Help Reveal Consumption Patterns
Queries typed by users into web search engines and their behavior on social media (searches, posts, shares, etc.) tell quite a lot about the feelings and desires of the internet community. Naturally this information can be used to gauge consumer preferences, which makes it especially interesting for market analysts. But it also can be used in a more general way to present consumption indicators. The basic idea behind these estimates is that the more people search specific brands, goods, or services, the more they are likely to consume in the near future.
In 2016, China’s leading search engine, Baidu, announced the first publication of its own set of macroeconomic indicators. The company is using data from several billion queries made by several hundred million users to monitor employment and consumption spending. Currently only companies, not individuals, can purchase access to Baidu indices. The company also has an equivalent of Google trends feature (Baidu Index) on its Chinese website. The service allows registered users to examine statistics for various keywords of interest. The data on search queries dates back to 2011. The most recent data can be broken down by age, gender, and province distribution. This feature can be helpful for identifying differences in consumer preferences and tastes.
Using Baidu data for market analysis can be especially helpful in measuring short-term shifts in consumers attitudes. For example, due to the controversy resulting from South Korea’s decision to deploy a missile defense system called THAAD in July 2016 and strong criticism and protest from neighboring China, South Korean companies and brands faced serious challenges on the China market. However, analysis of Baidu data showed that as far as cosmetics industry is concerned those fears were actually overblown. According to research firm Gartner L2, “Korean beauty brands saw 84 percent year-on-year Baidu Index growth in December 2016, a rate more than double that of their Western, Chinese, or Japanese rivals.” The Korean beauty industry saw some of that interest drop away in early 2017, but still remained comparable to other countries’ beauty firms.
Baidu Index capabilities can also be applied to analysis of macroeconomic situation in general. The basic idea behind this type of analysis is that keywords being searched for on the internet can be related to the searchers’ behavior or mood and perceptions. For example, volume data on searches using the keyword “layoff” (裁员 in Chinese) can be used to identify periods of stress at China’s job market, as one recent post in the Chinese internet has proposed. Moreover, the situation can also be looked upon from a regional perspective, as Baidu data is able to identify specific provinces where users are most actively searching for the keywords in question.
China’s top leading social media platforms, WeChat and Weibo, also provide services similar to Baidu Index. The WeChat and Weibo indices offers researchers an opportunity to know what keywords social media users are searching for. As WeChat can be considered the largest company among the Chinese internet giants in terms of number of accounts (over 1 billion), WeChat Index is especially interesting for marketers and those analyzing consumer preferences in general. However, the tool was launched only recently, in March 2017, and so far its capabilities are limited in comparison with the Baidu and Weibo indices. Users complain that the meaning of index number is unclear, only the most common keywords are listed, and many keywords actually cannot be found in WeChat Index.
E-commerce Data Reveal Shopping Activity
Consumer activity can also be measured directly on the basis of online purchases of internet users rather than information about their web searches. The Chinese e-commerce group Alibaba provides an opportunity to track the dynamics of transactions for a wide set of consumer goods, from shoes and clothing to home appliances and automobile parts. The second largest e-commerce giant, JD.com, aggregates information about consumer purchases into an online sales index. The index is calculated on a monthly basis. The company also provide estimates for 12 subindices tracking the situation in different consumer segments such as food and beverages, consumer electronics, sporting goods, etc.
Job Portals Indicate Labor Market Developments
Nowadays, the internet provides multiple opportunities for people searching job vacancies and companies looking for possible candidates. Thus online job portals represent huge data warehouses about labor market developments. Chinese online recruitment platform Zhaopin and the China Institute for Employment Research (CIER) at Renmin University since 2011 have released the CIER Employment Index. The index is calculated by dividing the number of job vacancies during a specified period by the number of unique job seekers that apply to jobs during the same period. Therefore, a falling index may signal worsening employment prospects for job seekers. Data are also available by sectors of the economy, groupings of region and cities, and the size of companies.
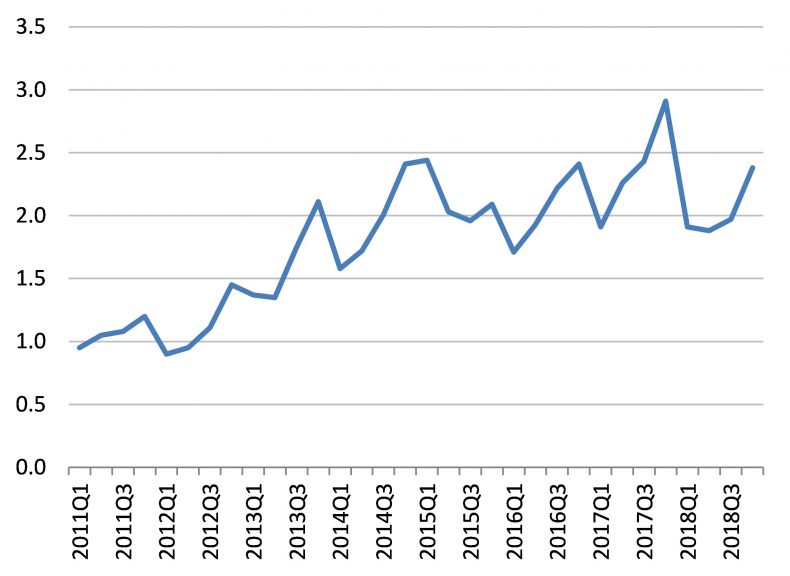
Figure 2: The CIER Employment Index, 2011-2018.
Card Transaction Data Help Measure Consumer Confidence
The internet is not the only source of alternative data on the state and dynamics of the Chinese economy. Information about card transaction volumes also can be used to construct indicators measuring consumer behavior. In China, the natural option for this kind of analysis is data provided by the country and the world’s biggest payment card issuer, China Unionpay. Since the year 2009, Xinhua News Agency and China Unionpay have jointly released the “Xinhua-Unionpay Bankcard Consumer Confidence Index (BCCI)” which is calculated through data mining bankcard transaction information and analyzing changes in urban consumption.
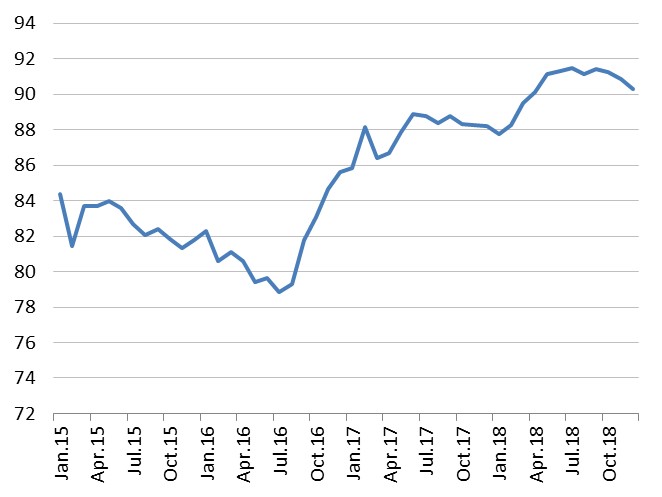
Figure 3: The Bank-card Consumer Confidence Index (BCCI) from 2015-2018.
Satellite Data to Track Manufacturing Activity
When it comes to analysis of China’s economy and long-term skepticism among economists about the quality of the official statistics, there is no such thing as too much alternative data. Thus it is no surprise that researchers are eager to grasp every opportunity and even go to the skies (quite literally) to reveal the China’s real economic trends.
Silicon Valley-based startup SpaceKnow since 2016 created the Chinese Satellite Manufacturing Index (SMI) based on analysis of billions of photos taken from commercial satellites. According to Satellite Today, the SMI index “tracks 6,000 industrial areas in China” and uses machine-learning algorithms to analyze images of various objects (buildings, roads, construction sites, etc.) to basically assign values for changes of economic activity over time and space. For example, as SpaceKnow CEO Pavel Machalek explains, if an area of grass-covered land later shows up covered by concrete, this change is interpreted as a sign of manufacturing expansion over the time period. Changes in economic activity of various locations are then summed up in the aggregated index (SMI) to provide a general snapshot of how the Chinese economy is faring. The meaning of the SMI is basically the same as the ordinary Purchasing Managers Index (PMI) measuring economic activity through survey of purchasing managers, with the 50-point threshold separating expansion from contradiction. The graph below presents how the SMI performs against PMI as calculated by the National Bureau of Statistics and financial media group Caixin.
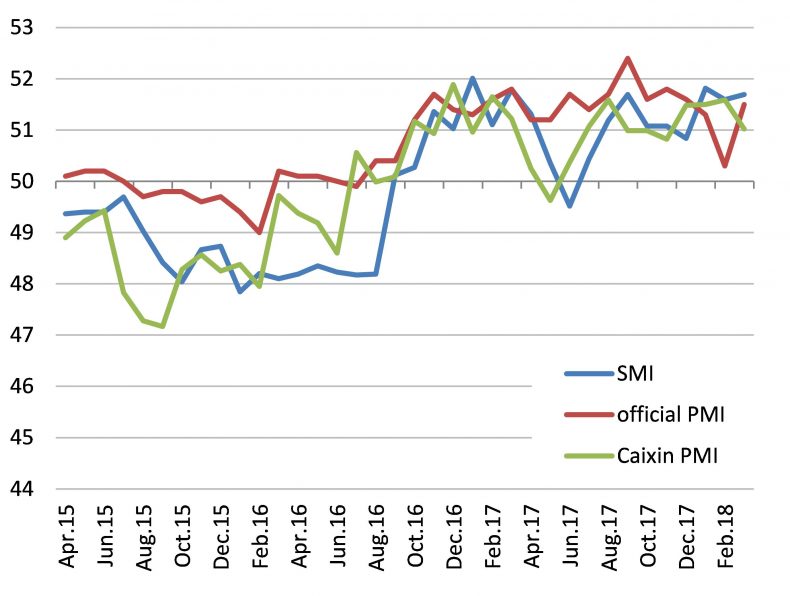
Figure 4: The Chinese Satellite Manufacturing Index (SMI) and Purchasing Managers Index (PMI) from 2015-2018.
Alternative Statistics Are Facing Setbacks in China
New data sources provide an opportunity to see Chinese economic developments through different lenses. Of course, online statistics are not free from errors and biases, and indicators published by private providers should also be used with caution. Moreover, the new data sources, although private in nature, are not totally independent from the government. Officials in public welcome the coming of new data sources, but if private indicators start to move in the opposite direction from official data there can be a very rapid change of attitude — as the example of Alibaba’s price index shows.
Alibaba Research Institute – the company’s think tank, which specializes in research on the “new economy” and changes in society brought about by advances in information technology – since 2011 has started to publish a series of price indices for online shopping, called Alibaba Shopping Price Indices or aSPI. However when the credibility of official Chinese statistics was called into question in 2013 by Western media due to the revealed gap between the Alibaba index and the country’s official gauge of consumer inflation, the reaction from the government was not long in coming. China’s National Bureau of Statistics (NBS) pored over the description of the Alibaba index and dispatched researchers to Hangzhou to interview its creators. The Alibaba index was criticized for not accounting properly for the quality change of products – a regular adjustment made by the official statisticians in calculating national price indices worldwide – which in theory can lead to higher estimates of consumer inflation. It remains unclear whether discontent from the government was the prime reason for the company’s decision, but in 2016 Alibaba Research Institute stopped updating its calculation of price indices, although historical data can still be found on its website. The NBS, for its part, in November 2013 initiated a big data partnership project with leading national IT companies to try and embrace new data sources into the statistics production process under official guidance.
The internet and other technological developments have created new ways of measuring economic activity, but until recently had not led to radical changes in the economic statistics landscape in China. In 2016, Baidu widely announced plans to use location and search information collected from its massive user base to help produce new measures of China’s economy. As Wu Haishan, a senior data scientist at the company, stated, “We think the government will also look forward to having other options, a way to look at this from a different angle.” However as time went by those ambitions seemed to wane. Since 2016 any mentions in the news of Baidu’s Big Data Lab developing an employment index or any other politically sensitive economic indicator have all but vanished.
It turns out that the government may not be so eager to look at the economy from too many angles.
Dmitriy Plekhanov is a senior researcher at the Institute for Complex Strategic Studies (ICSS), a Russian-based think tank. He is also a lecturer at the Lomonosov Moscow State University Business School (Lomonosov MSUBS)