


The following is an excerpt from DRI Trendlines “The Soundless Wailing: Water, Climate Change, and Security Risks in the Asia-Pacific.” Access the full report here.
Urbanization and Water
Rapid urbanization leads to increased competition over the same water resources over a small, densely populated area, leading to unequal access to safe water resources, and environmental degradation and exploitation.
The proportion of countries’ population residing in a few highly concentrated urban areas has been increasing. In low to middle income countries in the Asia-Pacific, the rate of migration from rural to urban regions is faster, because of rural economic stagnation (overdependence on agriculture) and insufficient rural infrastructure (health and education facilities). The urban-rural economic divide in high income countries (Japan and Australia) is lower and more stable.
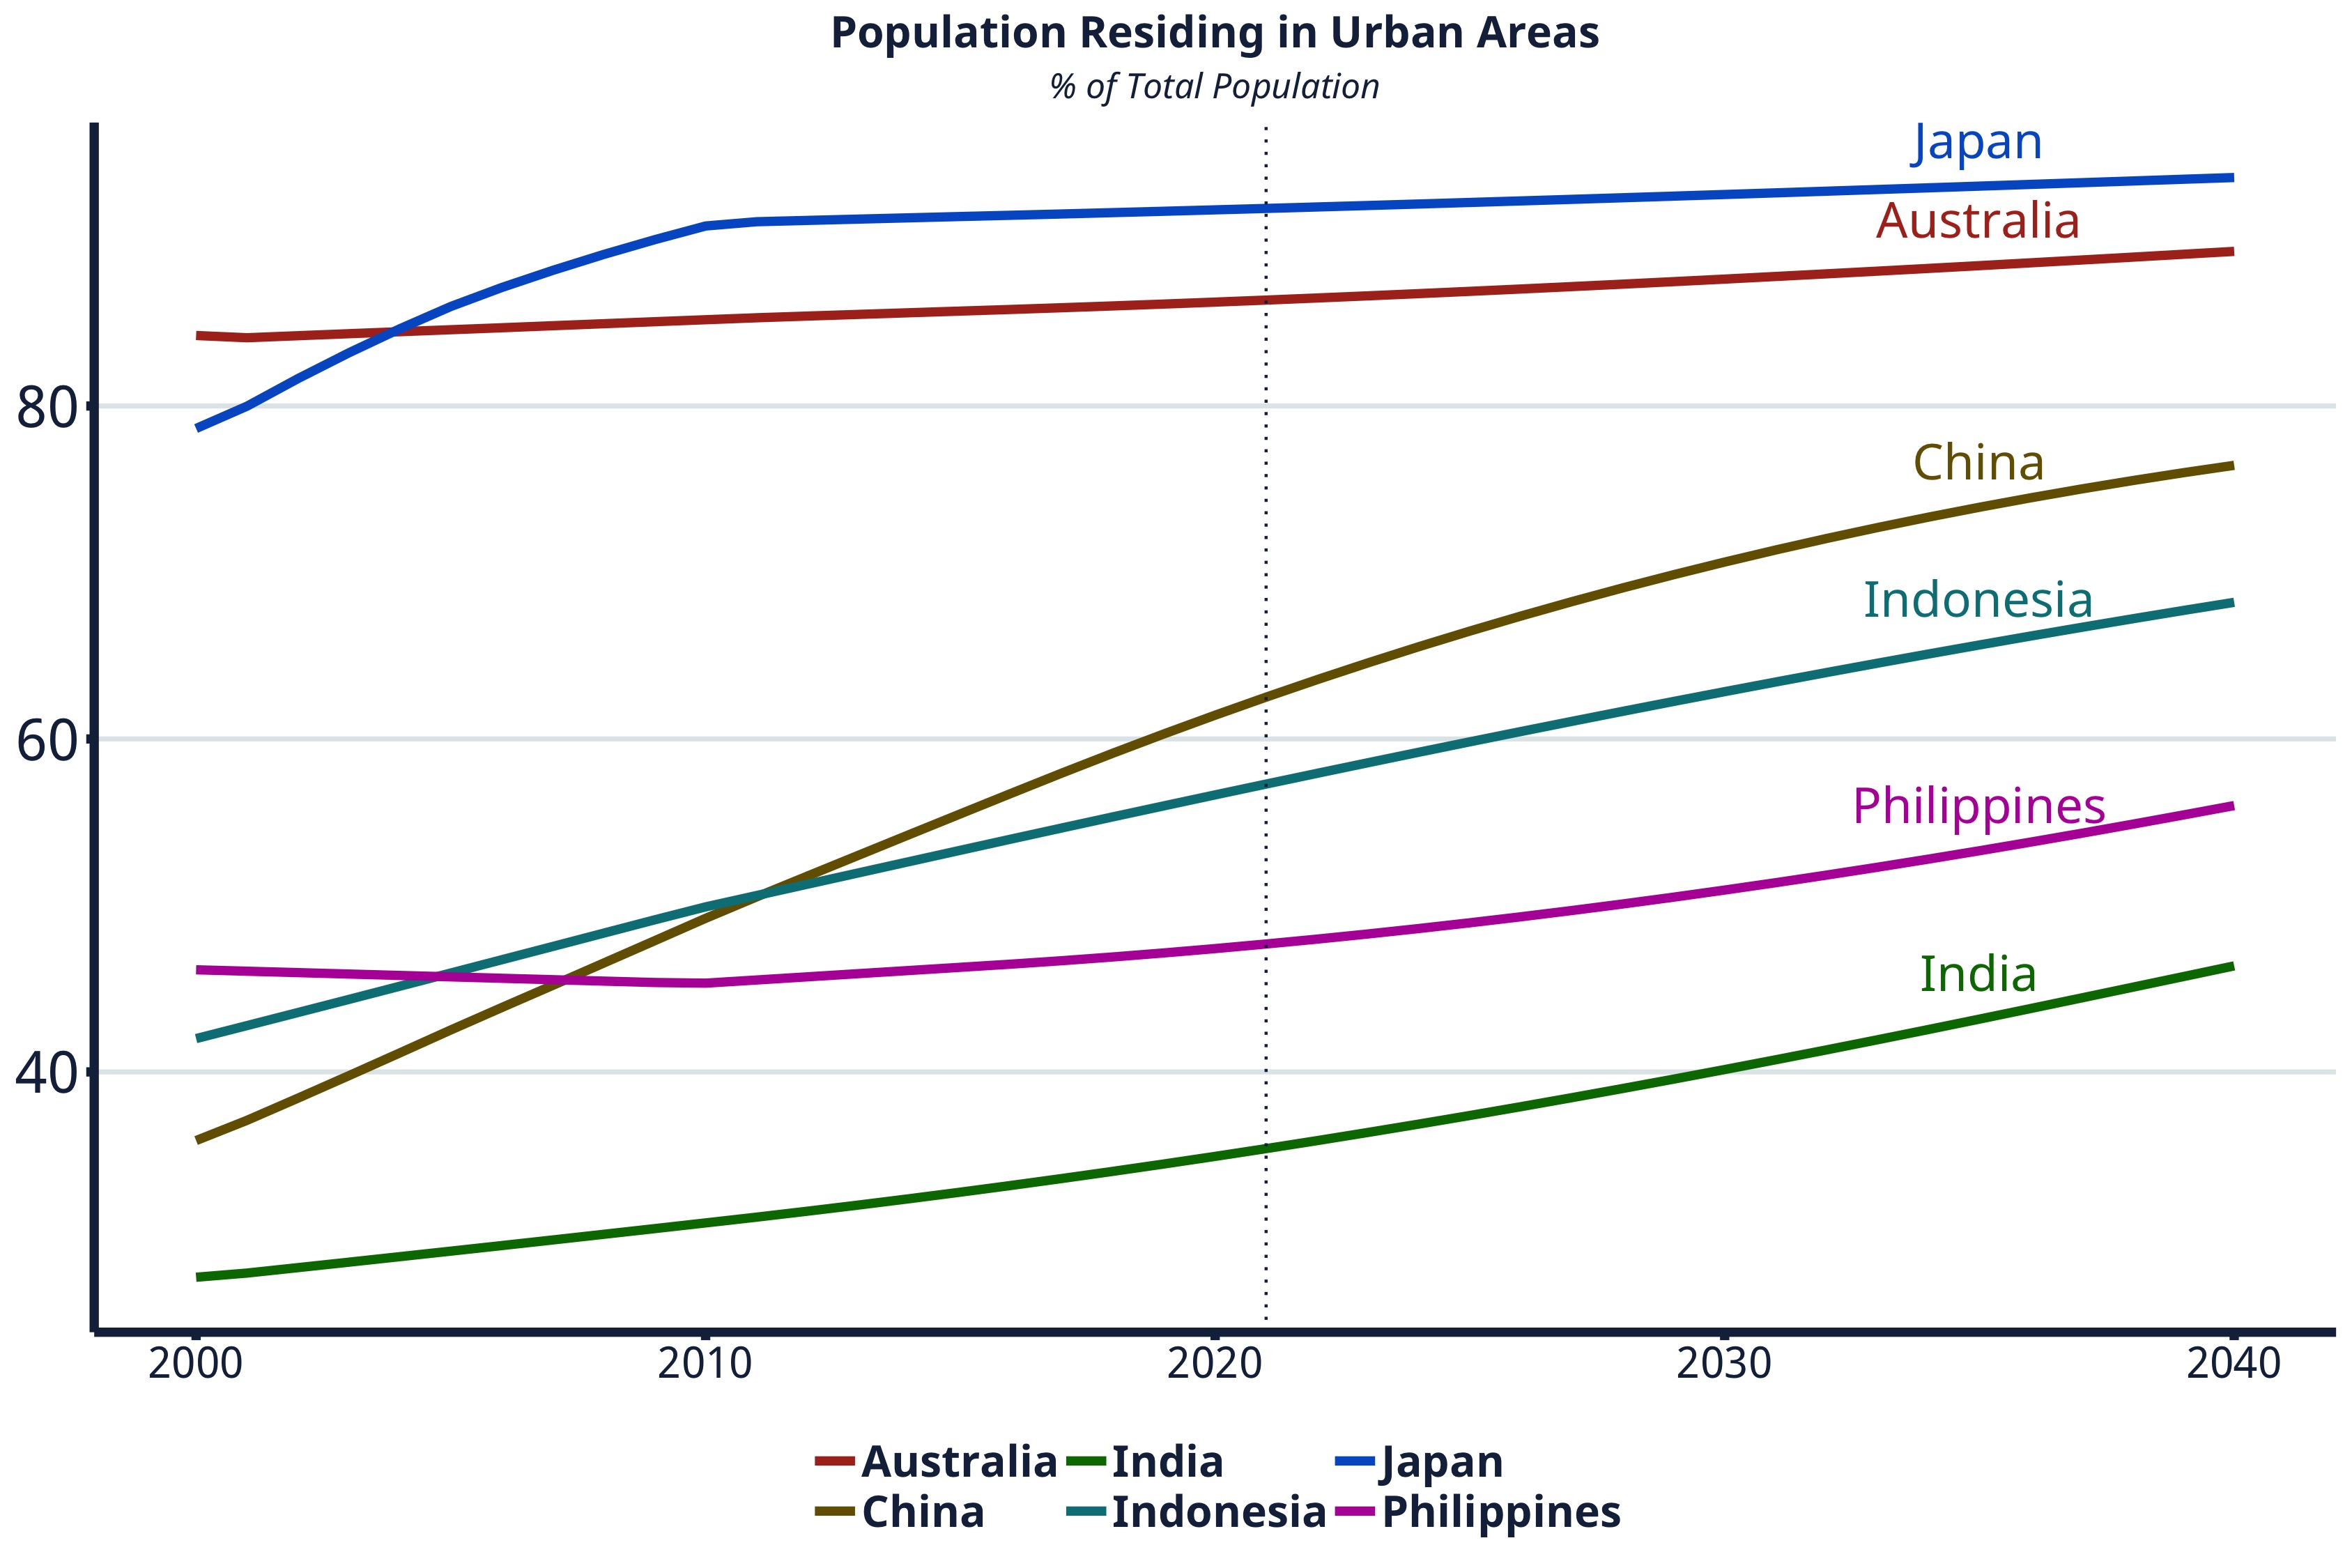
Population residing in urban areas as percentage of total population. The data after the dotted line is based on World Bank estimates. Data: World Bank. Graphics: DRI
Countries like India, China, the Philippines, and Indonesia have close to 40 percent of their workforce employed in agriculture, which only accounts for 10-12 percent of the nation’s output. This translates to a rural push factor (limited economic opportunities), resulting in an increased strain on urban land, infrastructure, and facilities.
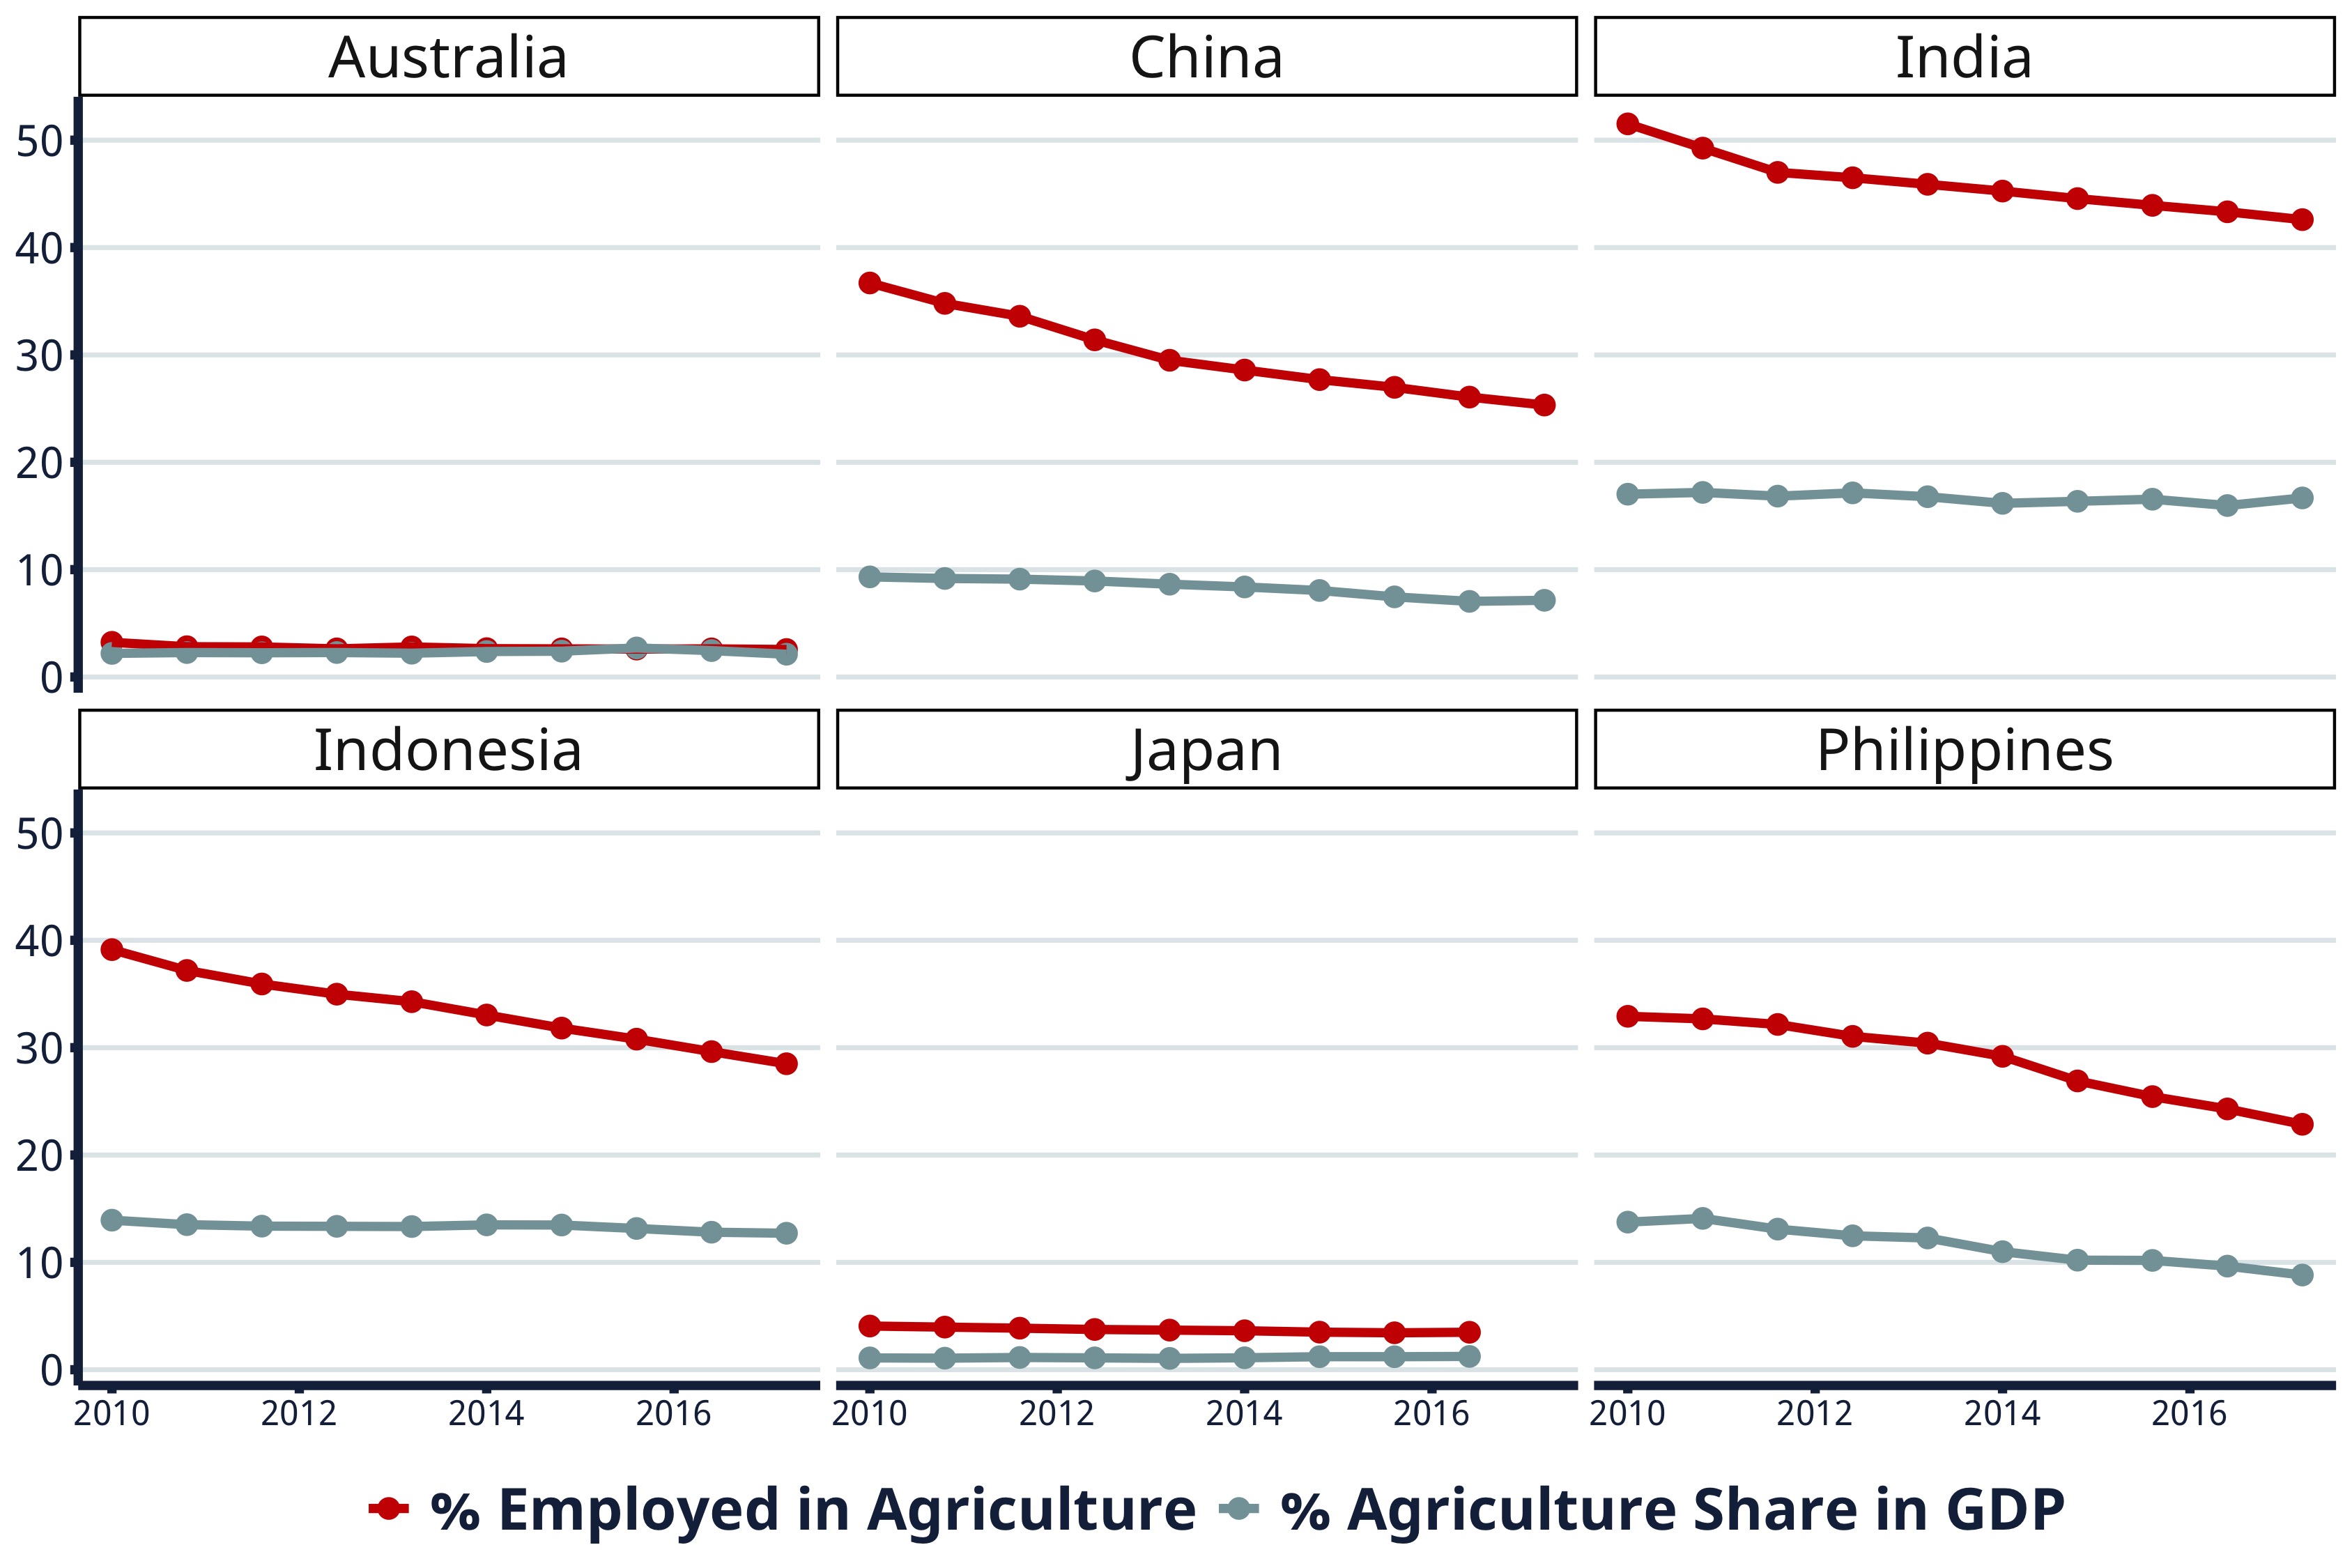
Comparison of percentage of labor force employed in agriculture and percentage share of agriculture in GDP. Data: World Bank. Graphics: DRI
Salinization of Arable Land
Climate change drives soil salinization, disrupting water tables, reducing water availability for agriculture, and reducing groundwater supply. This affects food, livelihood, and water security, especially in countries with higher-than-average rates of labor engagement in agriculture. These factors have the capability to inflame underlying tensions and create atmospheres conducive to insurgencies and civil unrest.
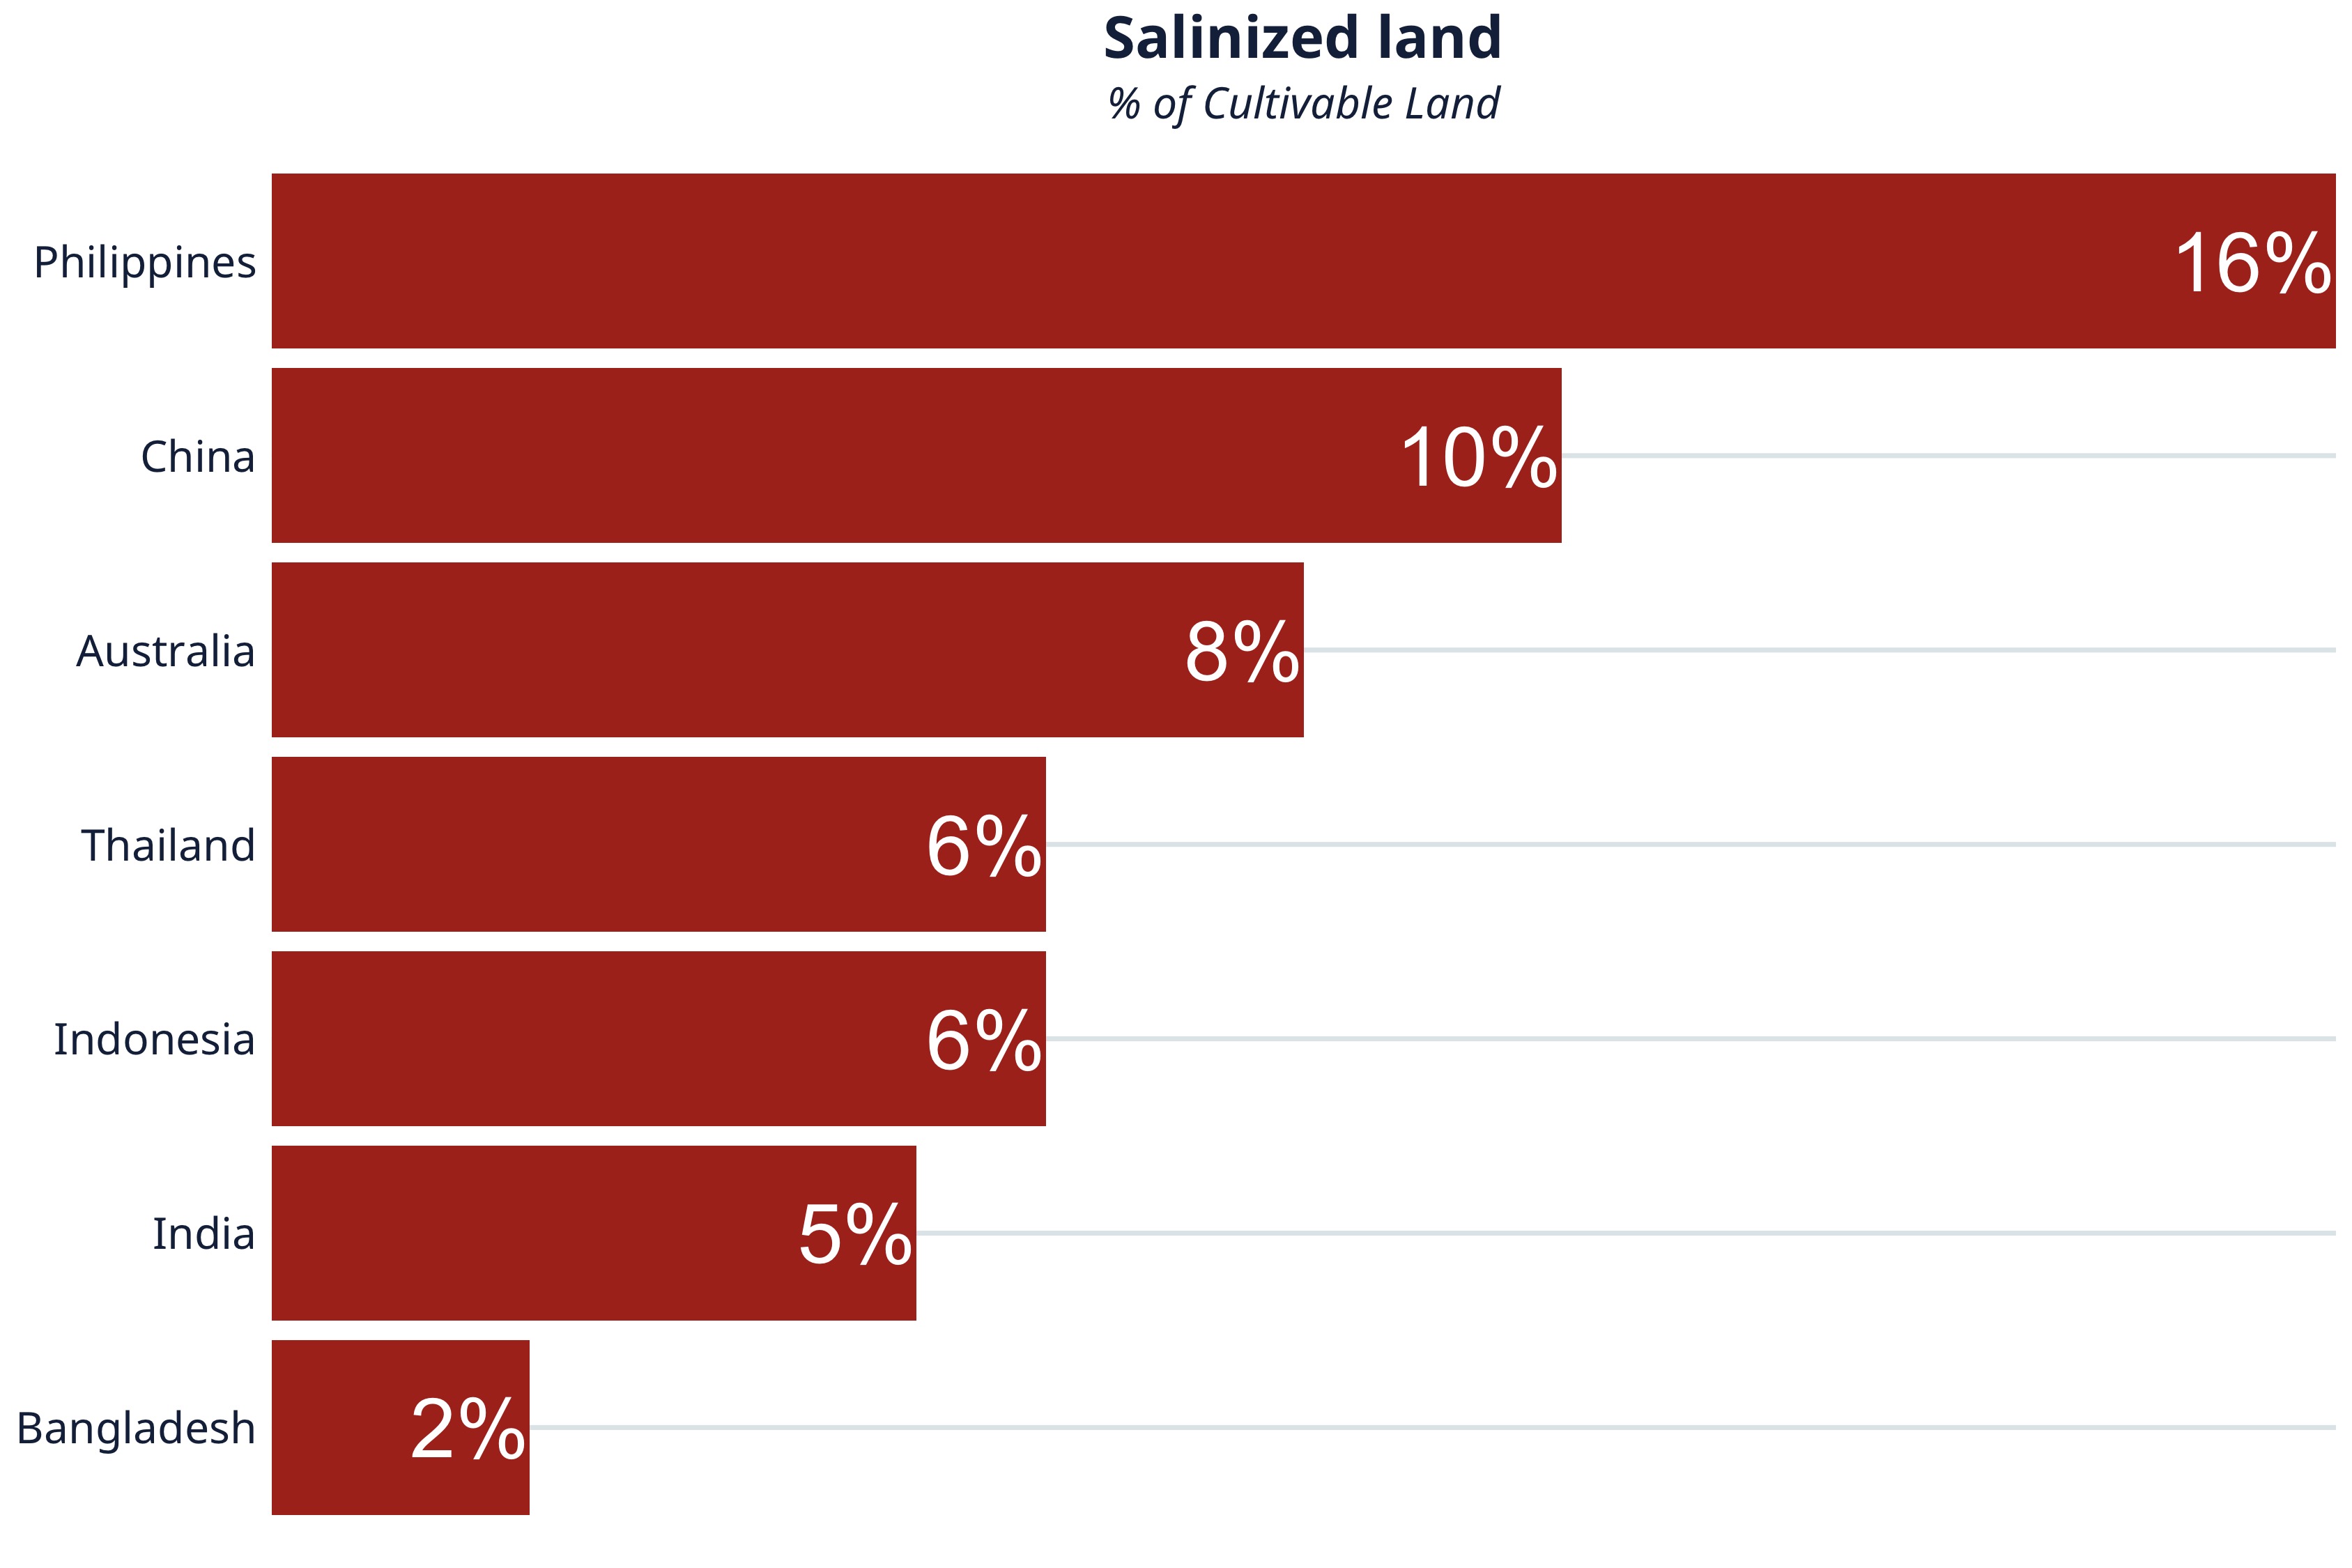
Salinized land as percent of cultivable land, most recent data. Data: FAOSTAT. Graphics: DRI
Urban Vulnerability
Measuring the vulnerability of urban areas to sudden, adverse climatic events, or drastic changes to food and water securities, can be done through indicators like improper and weak housing infrastructure, poverty, and population density. If, for example, a sudden cloud burst engulfs a city in Myanmar, where around 56 percent of the people live in slums, the number of people affected and displaced will be potentially much higher compared to a similarly sized city in Indonesia. Similarly, someone in the Philippines is up to 17 times more likely to be killed by a natural disaster than someone in Japan, although the likelihood and frequency of disasters in Japan is overall higher.
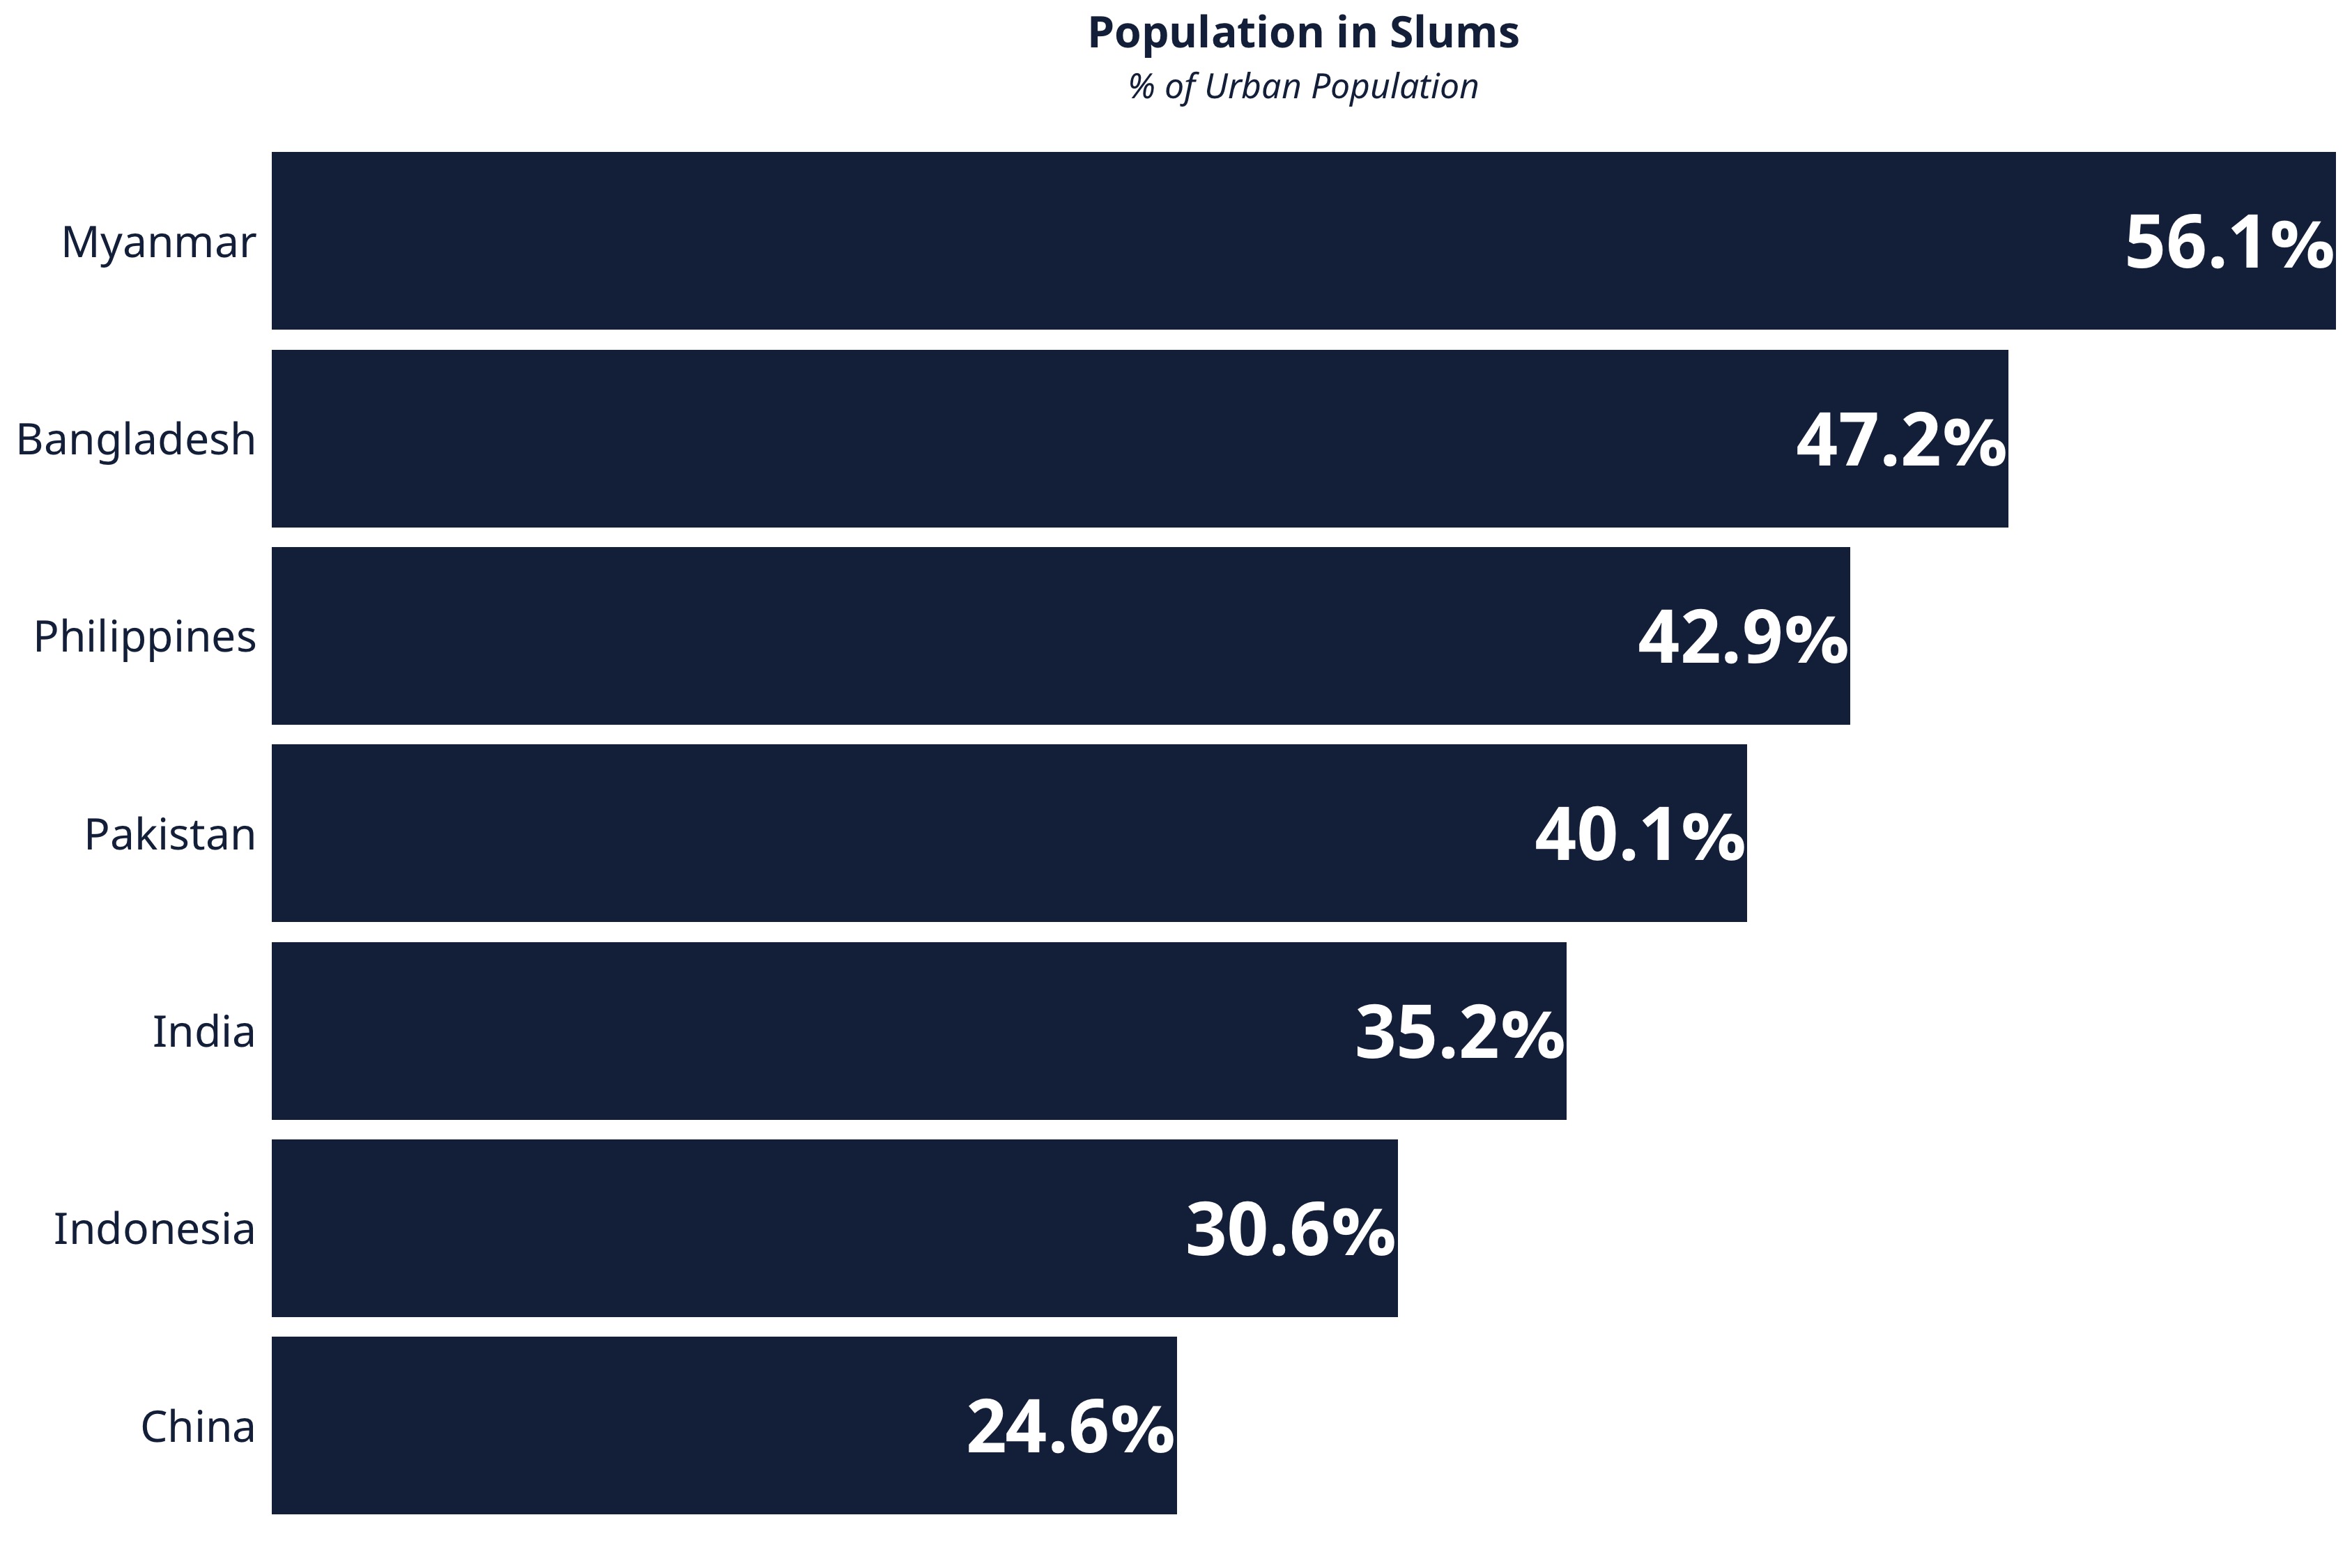
Percentage of urban population that resides in slums, most recent data. Data: World Bank. Graphics: DRI
Urban Heat Islands
Concentrated urban regions are warmer than their surrounding regions. There are a number of causes: lack of natural land cover, lack of evapotranspiration (the sum of evaporation from the land surface plus transpiration from plants), overcrowding, indiscriminate use of fossil fuels, and waste heat generated by energy usage. These “Urban Heat Islands” are known to cause unexpected precipitation and to increase the magnitude and frequency of heatwaves.
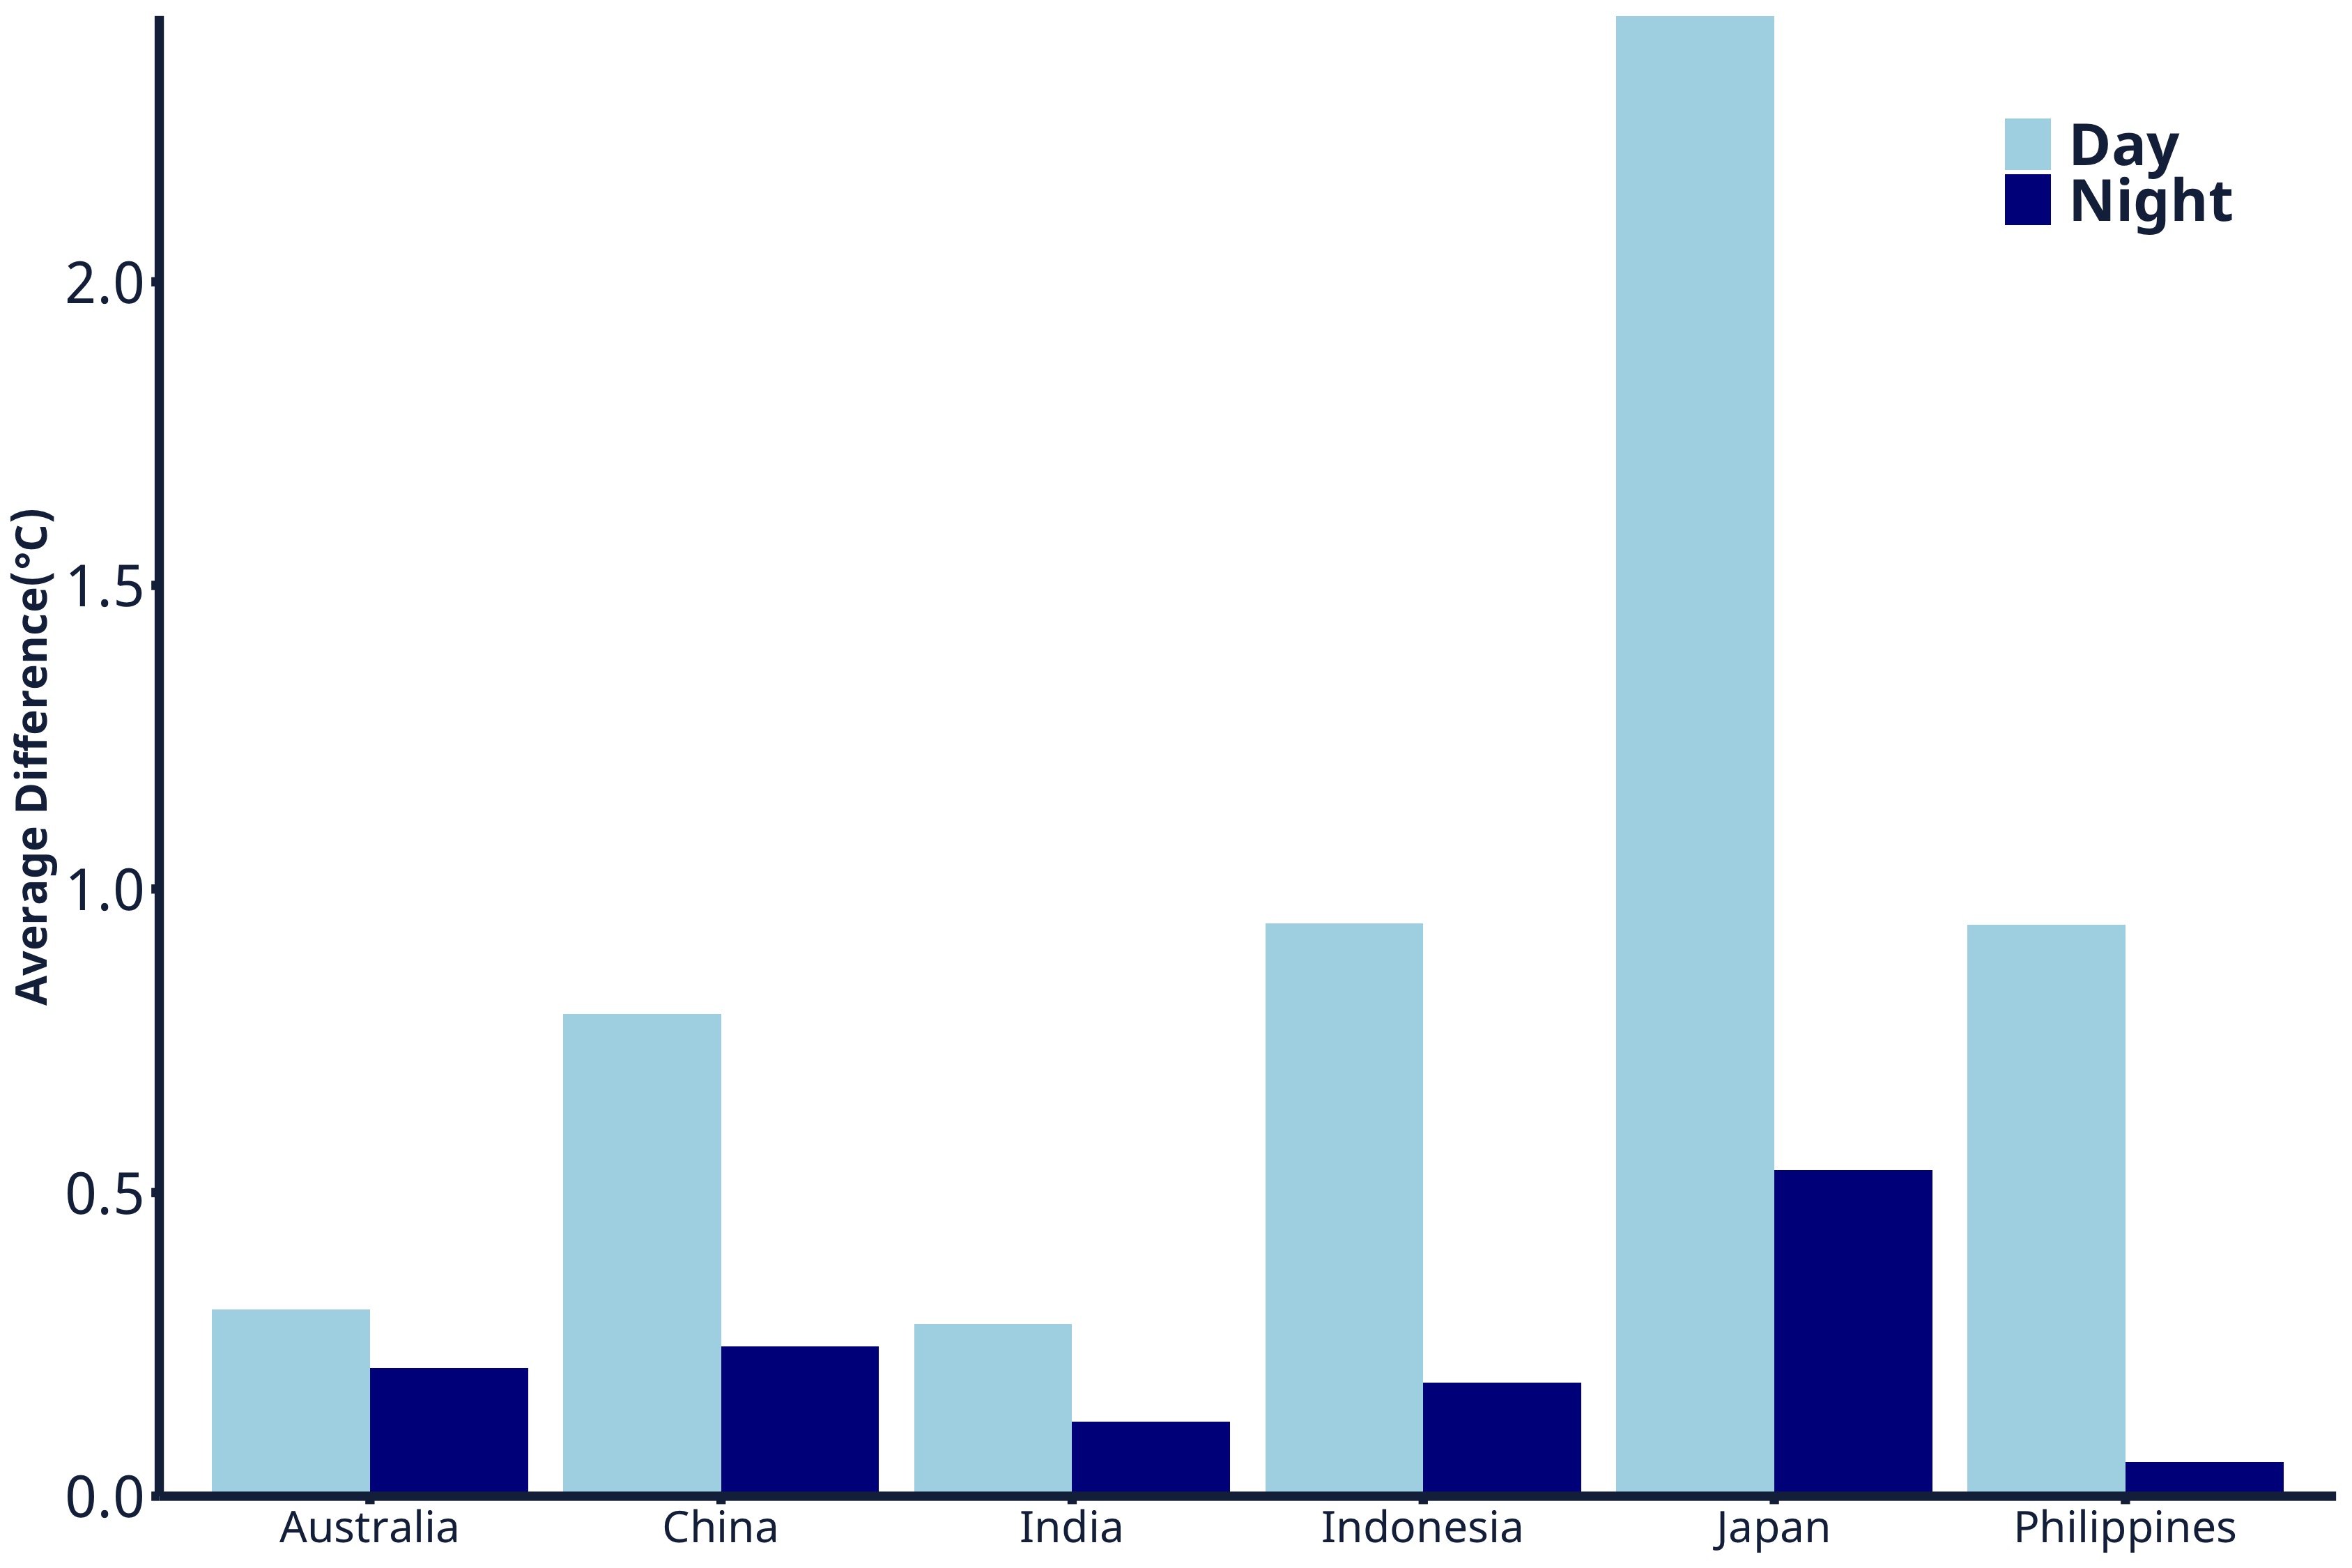
Country-wise average temperature difference (in Celsius) between urban centers and their surrounding areas, 2010. Data: Center for International Earth Science Information Network (CIESIN), Columbia University. Graphics: DRI
The average difference between urban areas, and the areas surrounding them, is most drastic in Japan: cities, on average, were 2 degrees Celsius hotter than their immediate surroundings in the summer months of 2010.
The preceding was an excerpt from DRI Trendlines “The Soundless Wailing: Water, Climate Change, and Security Risks in the Asia-Pacific.” Access the full report here.