

")


The following is an excerpt from DRI Trendlines “Here Be Dragons? Pakistan’s Economy and the China-Pakistan Economic Corridor.” Access the full report here.
Post implementation of BRI, Chinese overseas investment commitments in Pakistan surged and reached an all-time high in 2015.
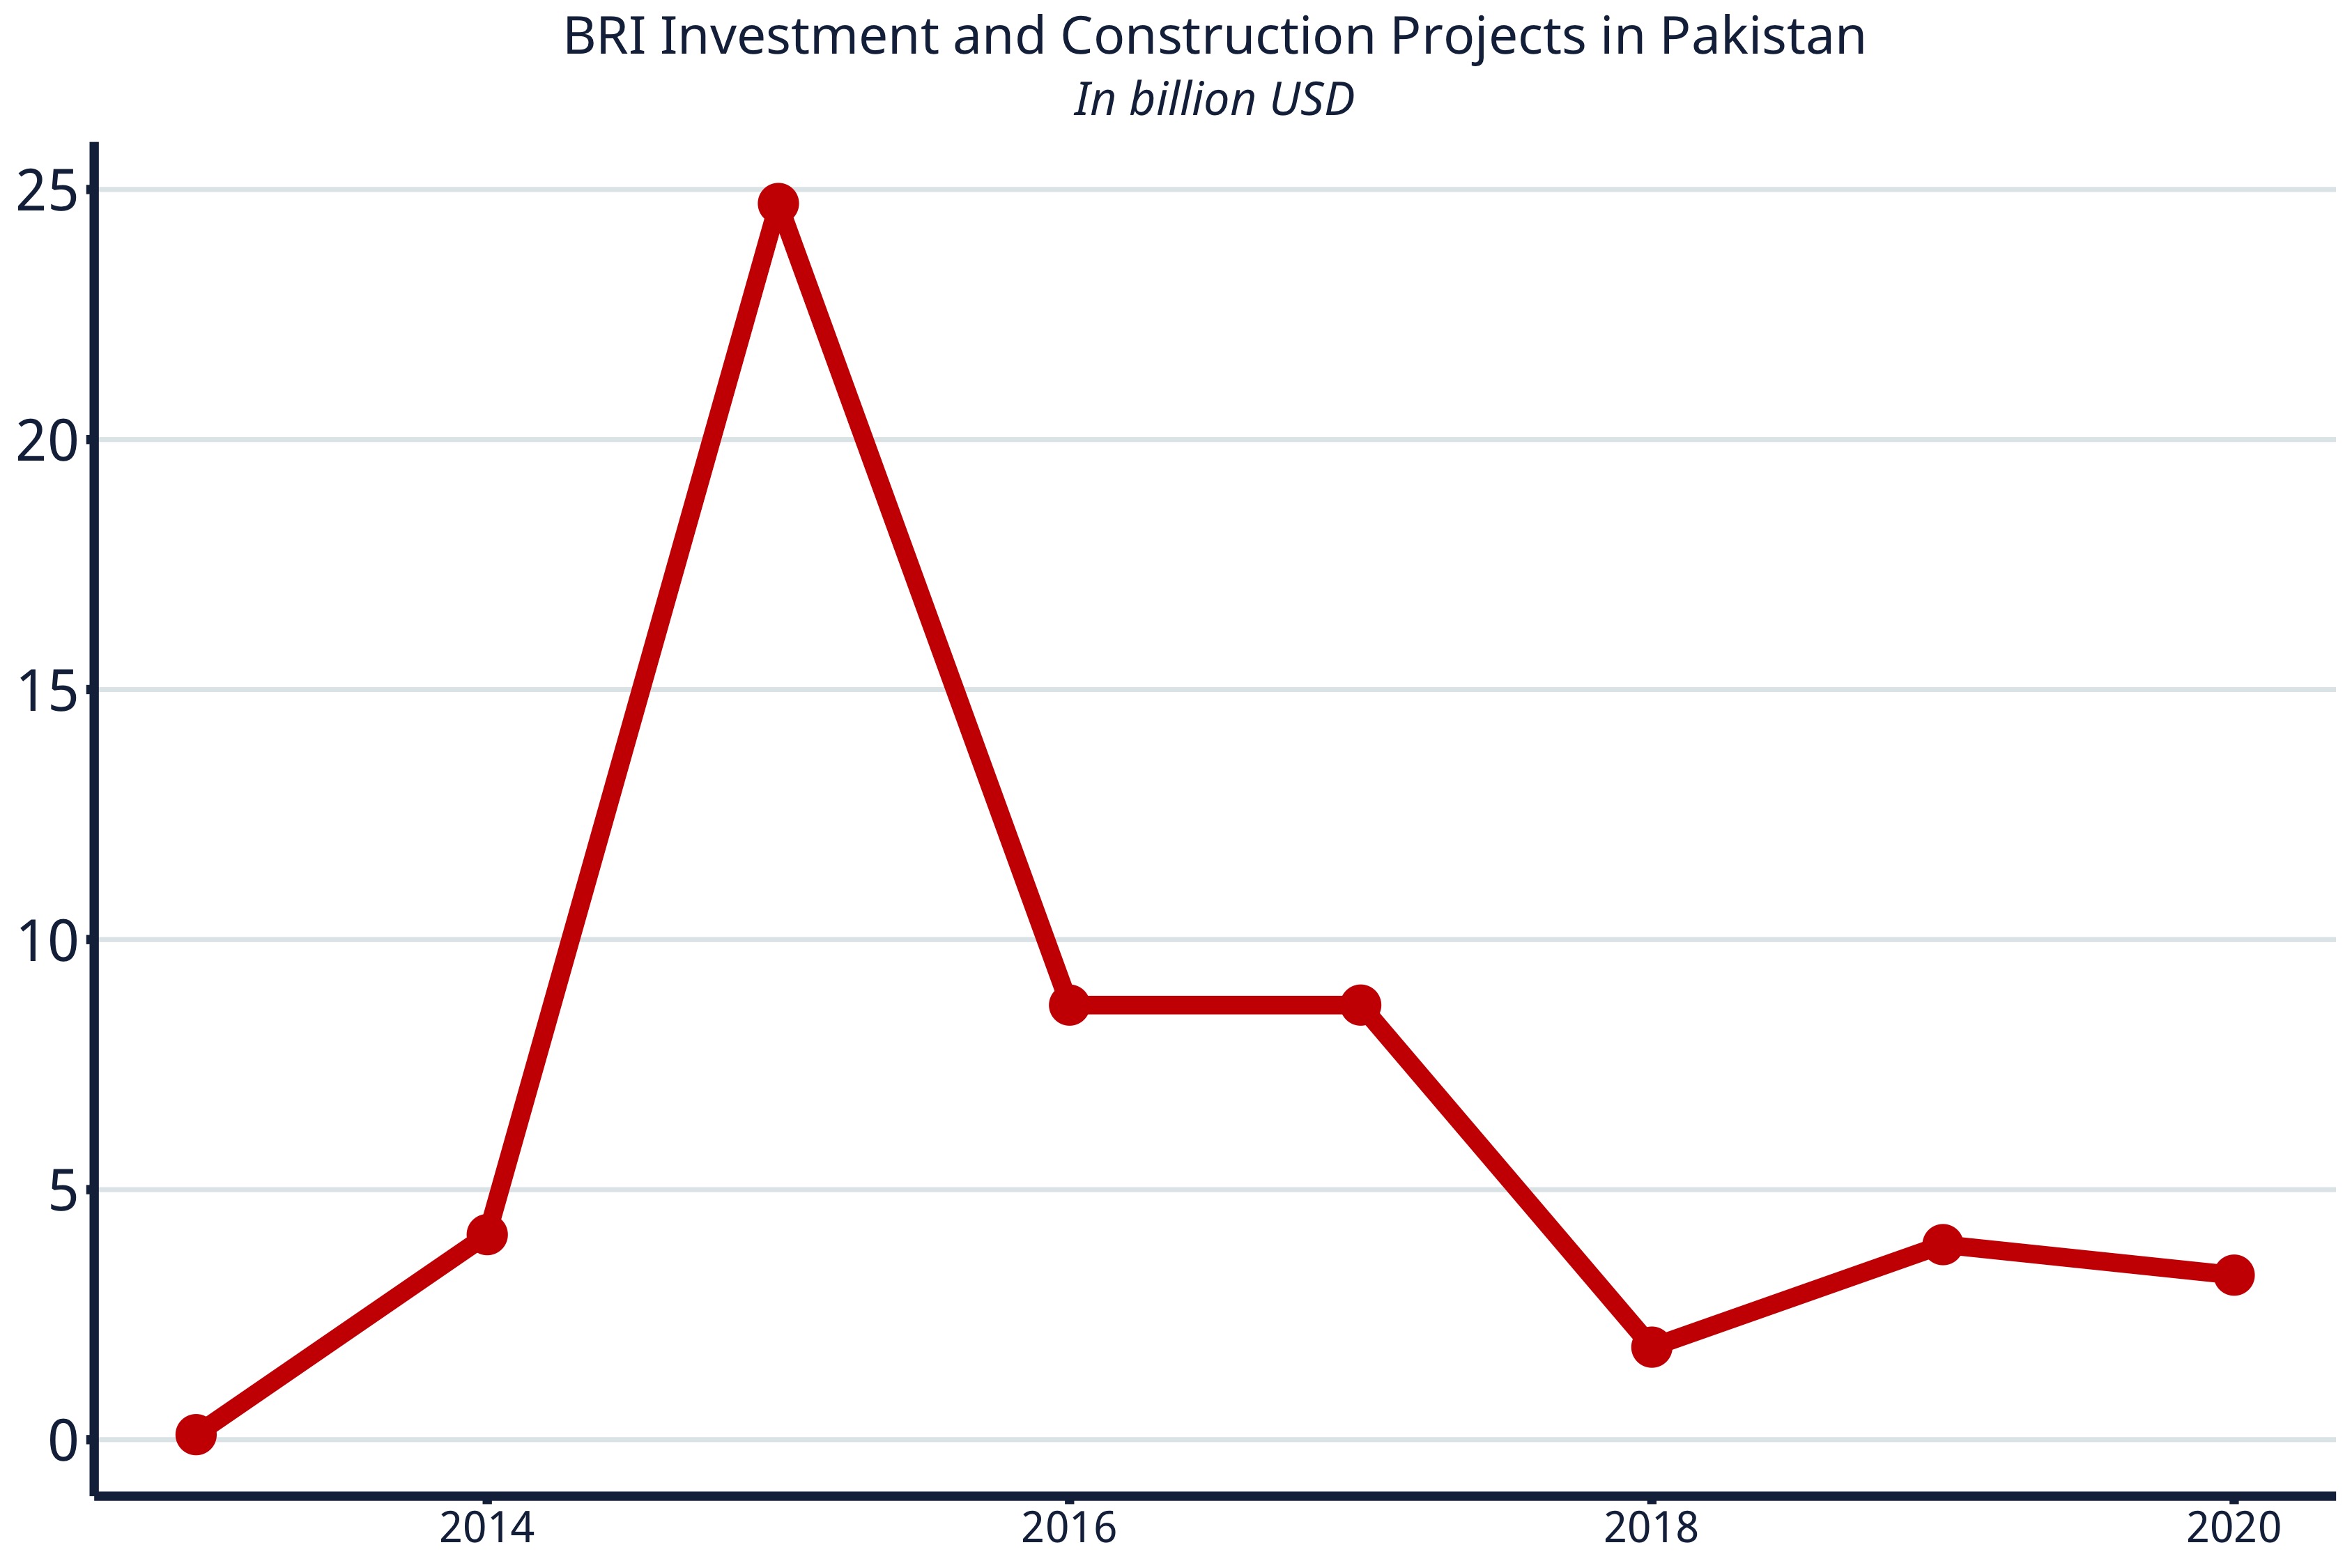
Data: American Enterprise Institute and The Heritage Foundation, “China Global Investment Tracker.” Graphics: DRI.
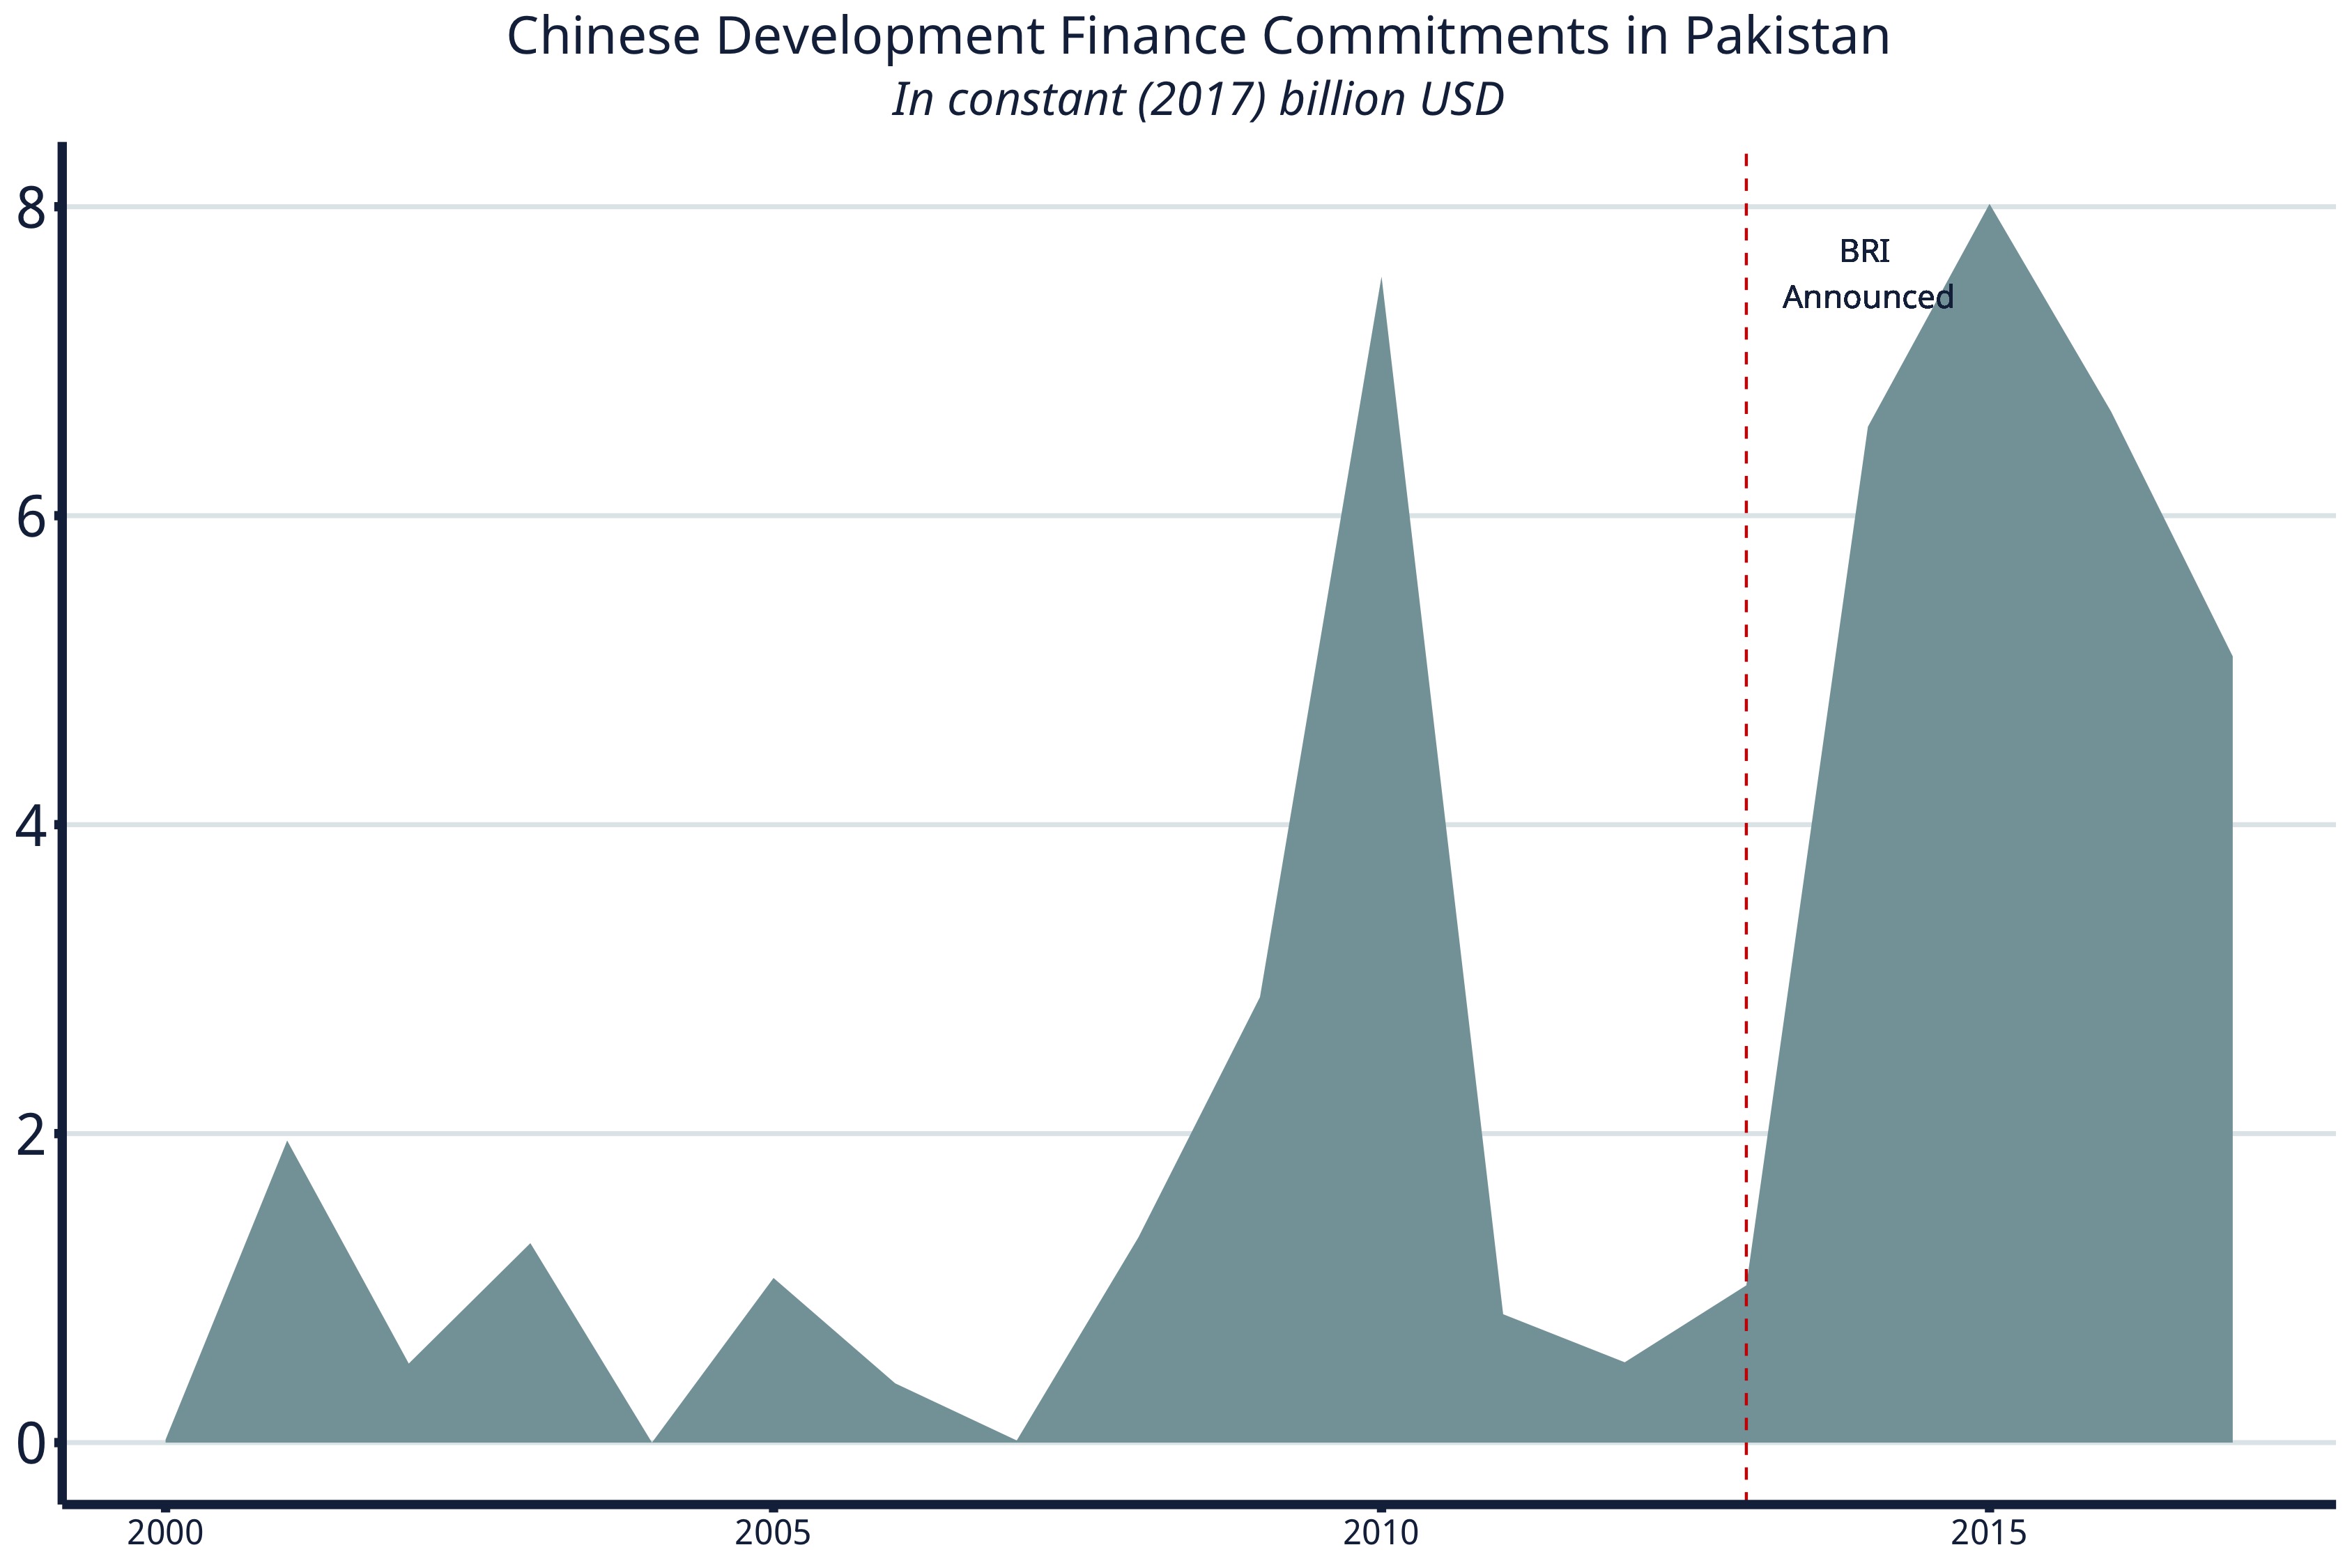
Data: AidData, “Global Chinese Development Finance Dataset, Version 2.0.” Graphics: DRI.
In 2017, a Pakistan-China Joint Cooperation Committee agreed to prioritize nine Special Economic Zones (SEZs) out of the 46 SEZs which have been identified along the CPEC route. They are indicated in the map below, along with the number of terrorism-related incidents by province.
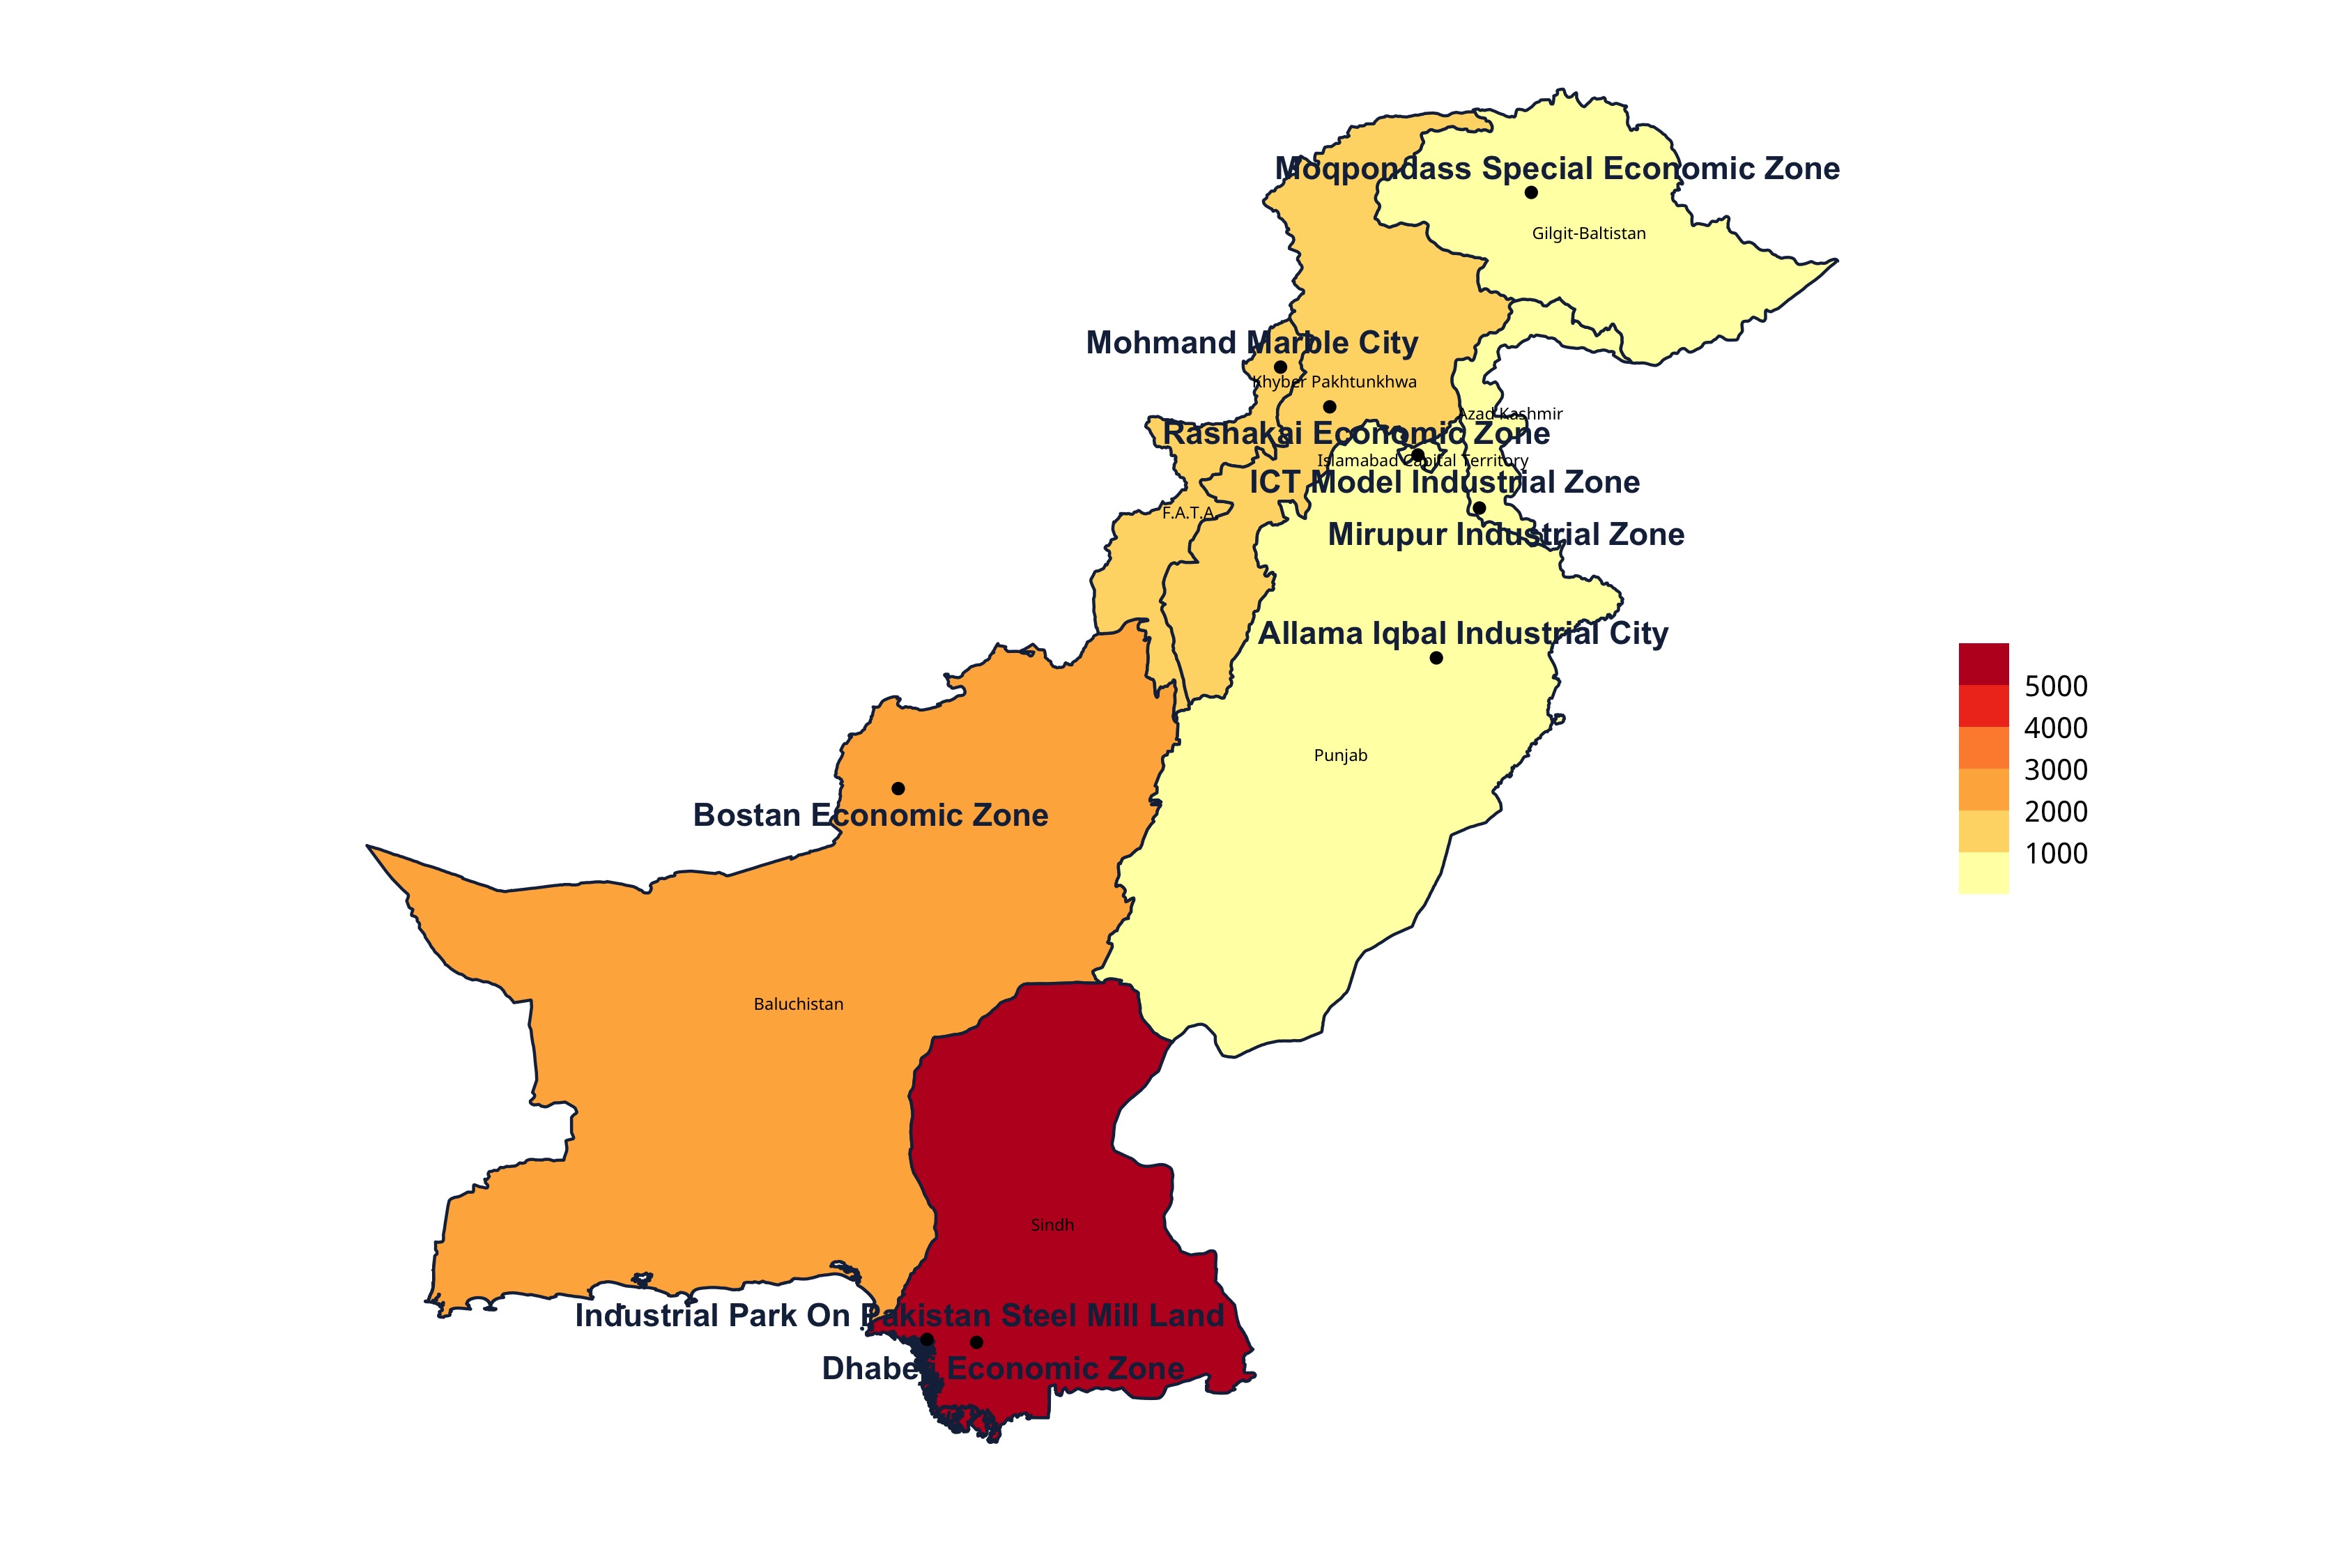
Number of Terrorism-Related Incidences in the Provinces of Pakistan From 2013 to 2020 Overlayed With Key CPEC SEZs. Data: South Asia Terrorism Portal, “Datasheet-Pakistan.” Graphics: DRI.
Two of the major zones fall in Sindh, the province with the highest number of terrorism attacks post implementation of BRI. The map indicates the persistent security threat of terrorism to CPEC projects in the country.
The preceding was an excerpt from DRI Trendlines “Here Be Dragons? Pakistan’s Economy and the China-Pakistan Economic Corridor.” Access the full report here.