


")


The following is an excerpt from the latest DRI Trendlines “Demography’s Long Shadow: Population and Prosperity in China, India, Japan.” Access the full report here.
This chapter looks at how the populations of China, India, and Japan are changing, by looking at median age, working population, sex and dependency ratios, among other variables—and how they are likely to evolve over the course of the century.
To start, median ages are increasing in all three countries.
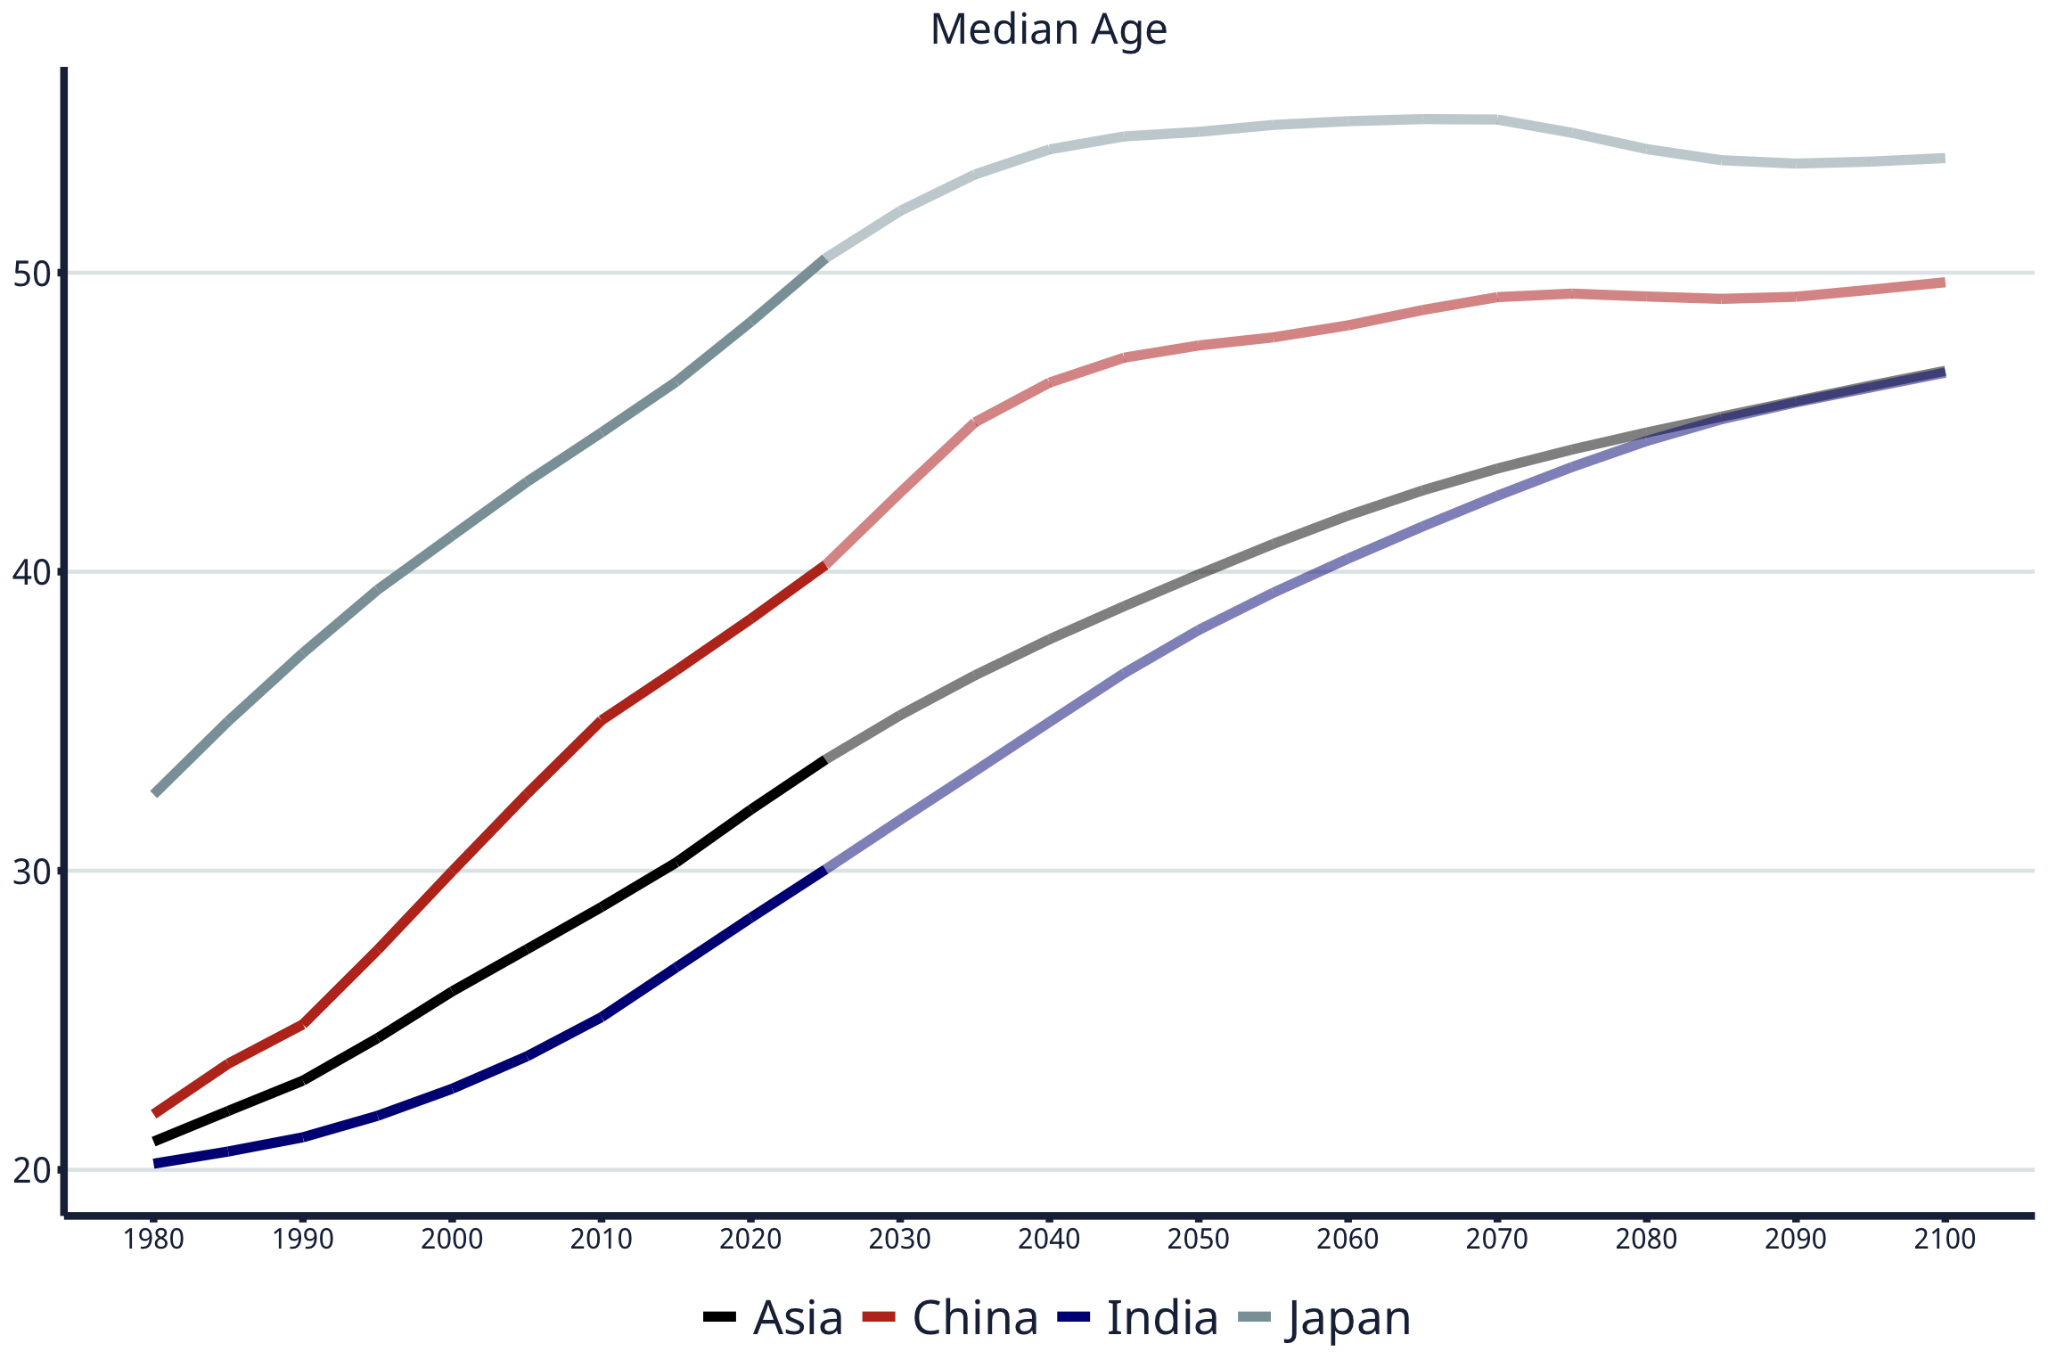
Median age of population (1950-2100). Data: Department of Economic and Social Affairs, United Nations
Around one-third of Japan’s population currently is above the age of 65.
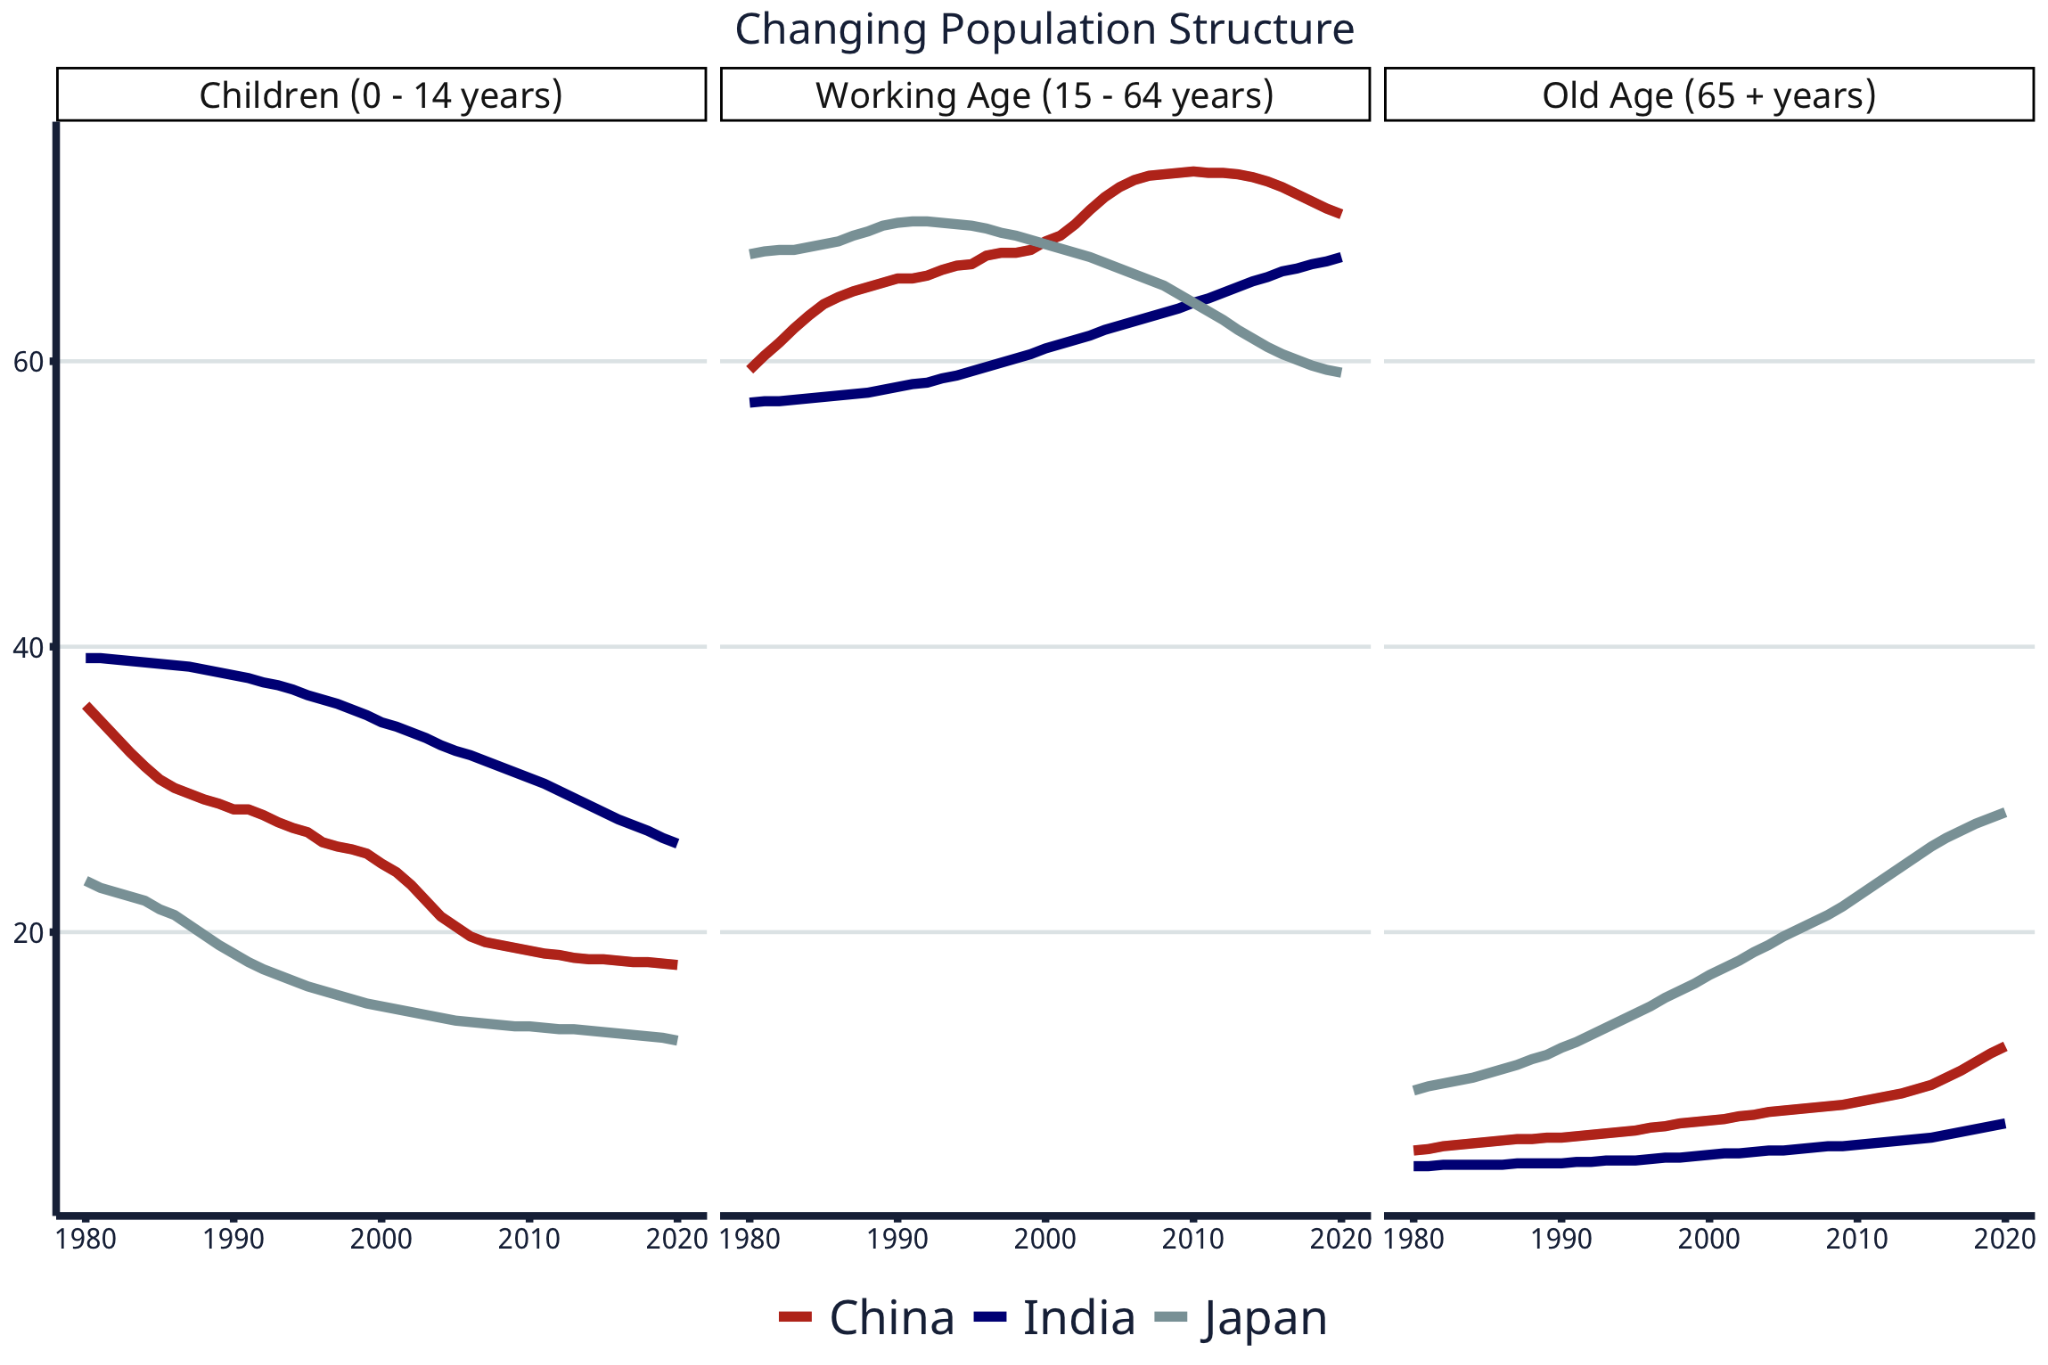
Population by age groups (percent of total population) (1990 – 2020). Data: World Bank
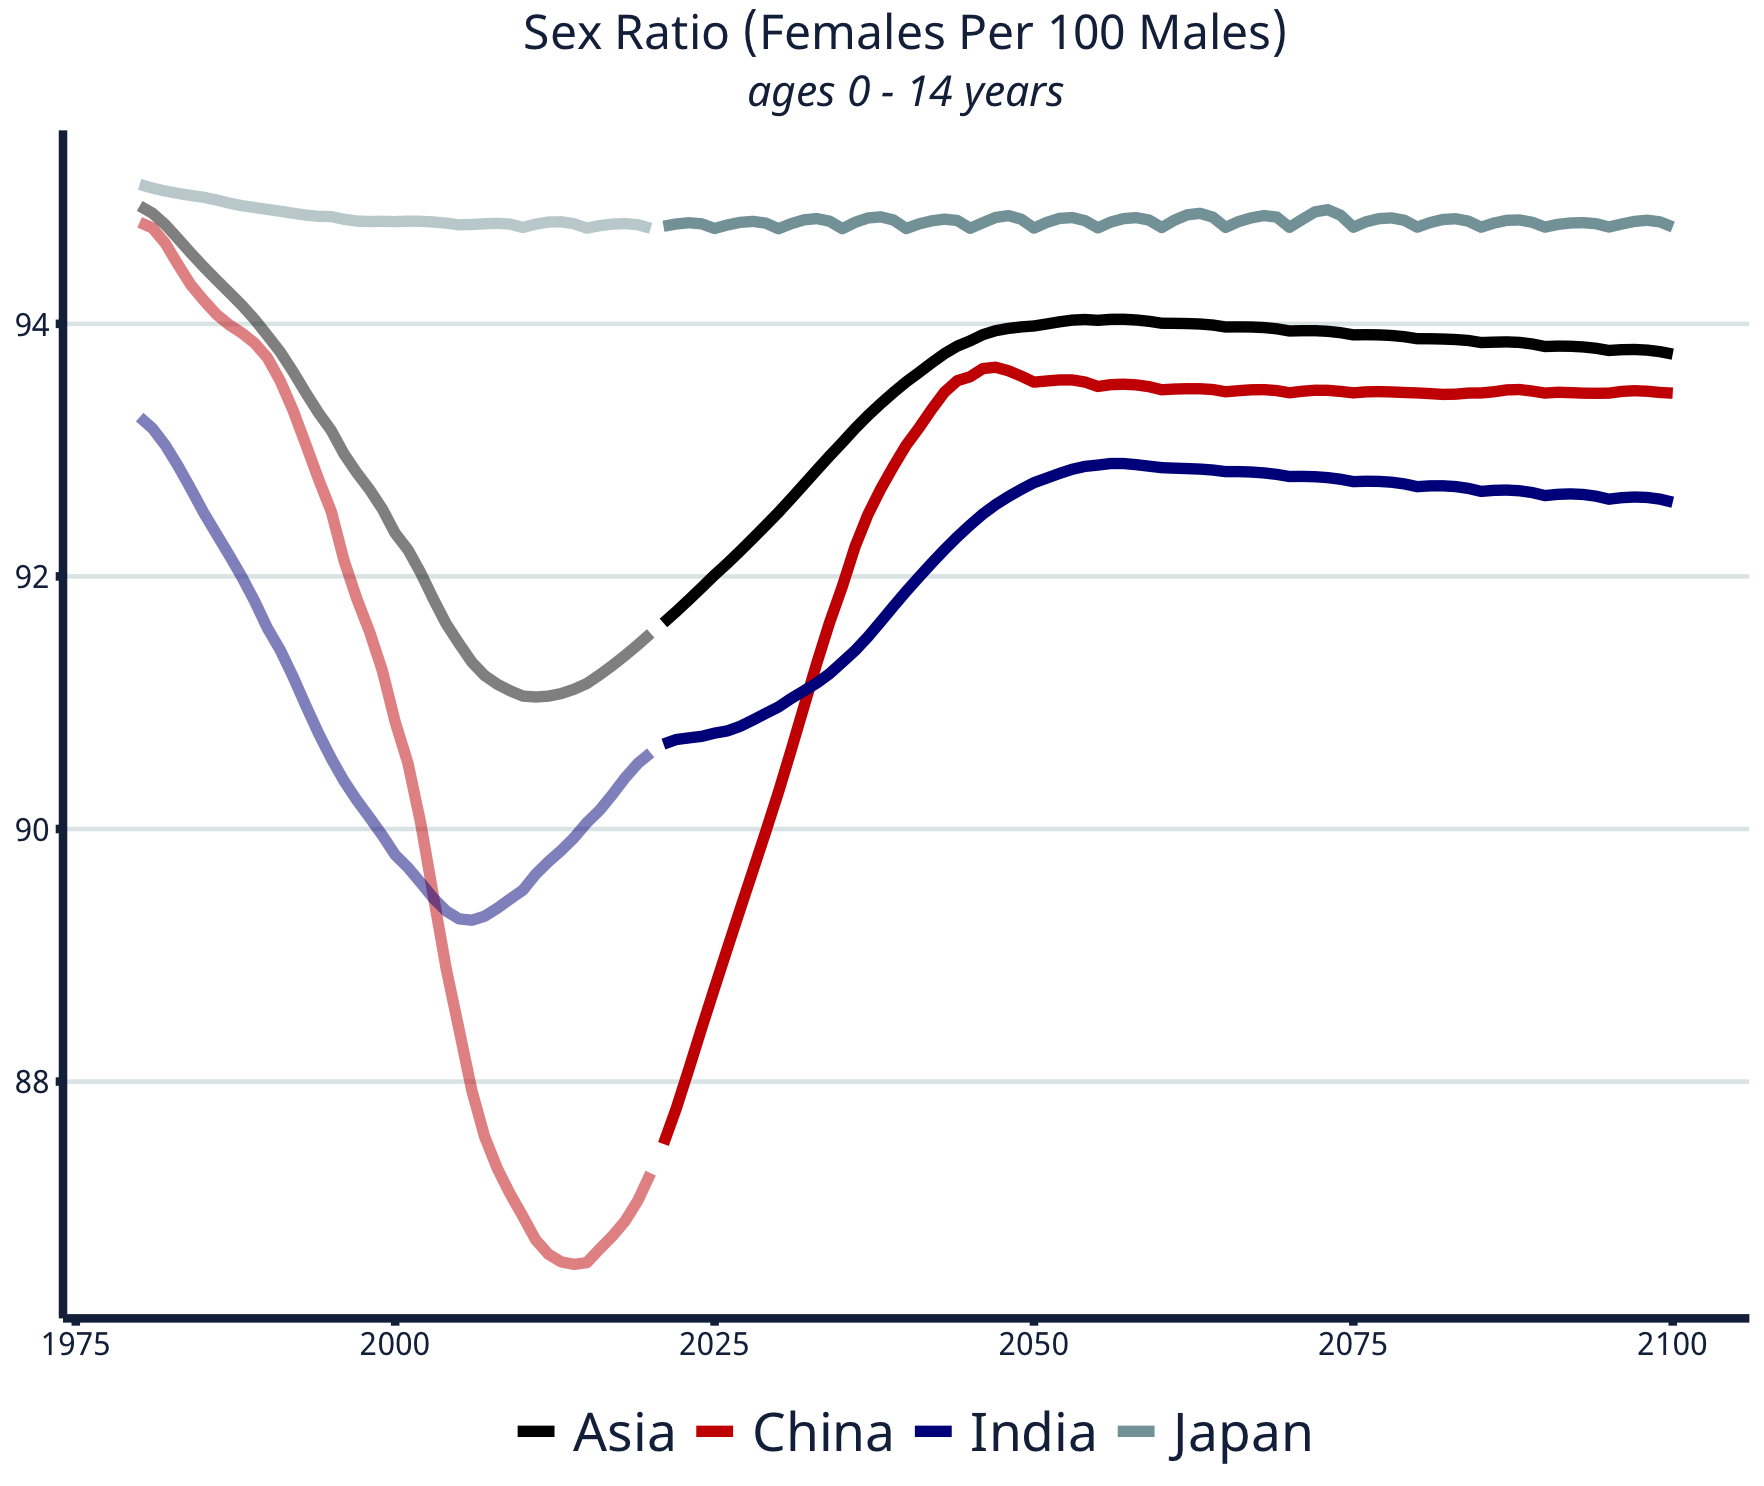
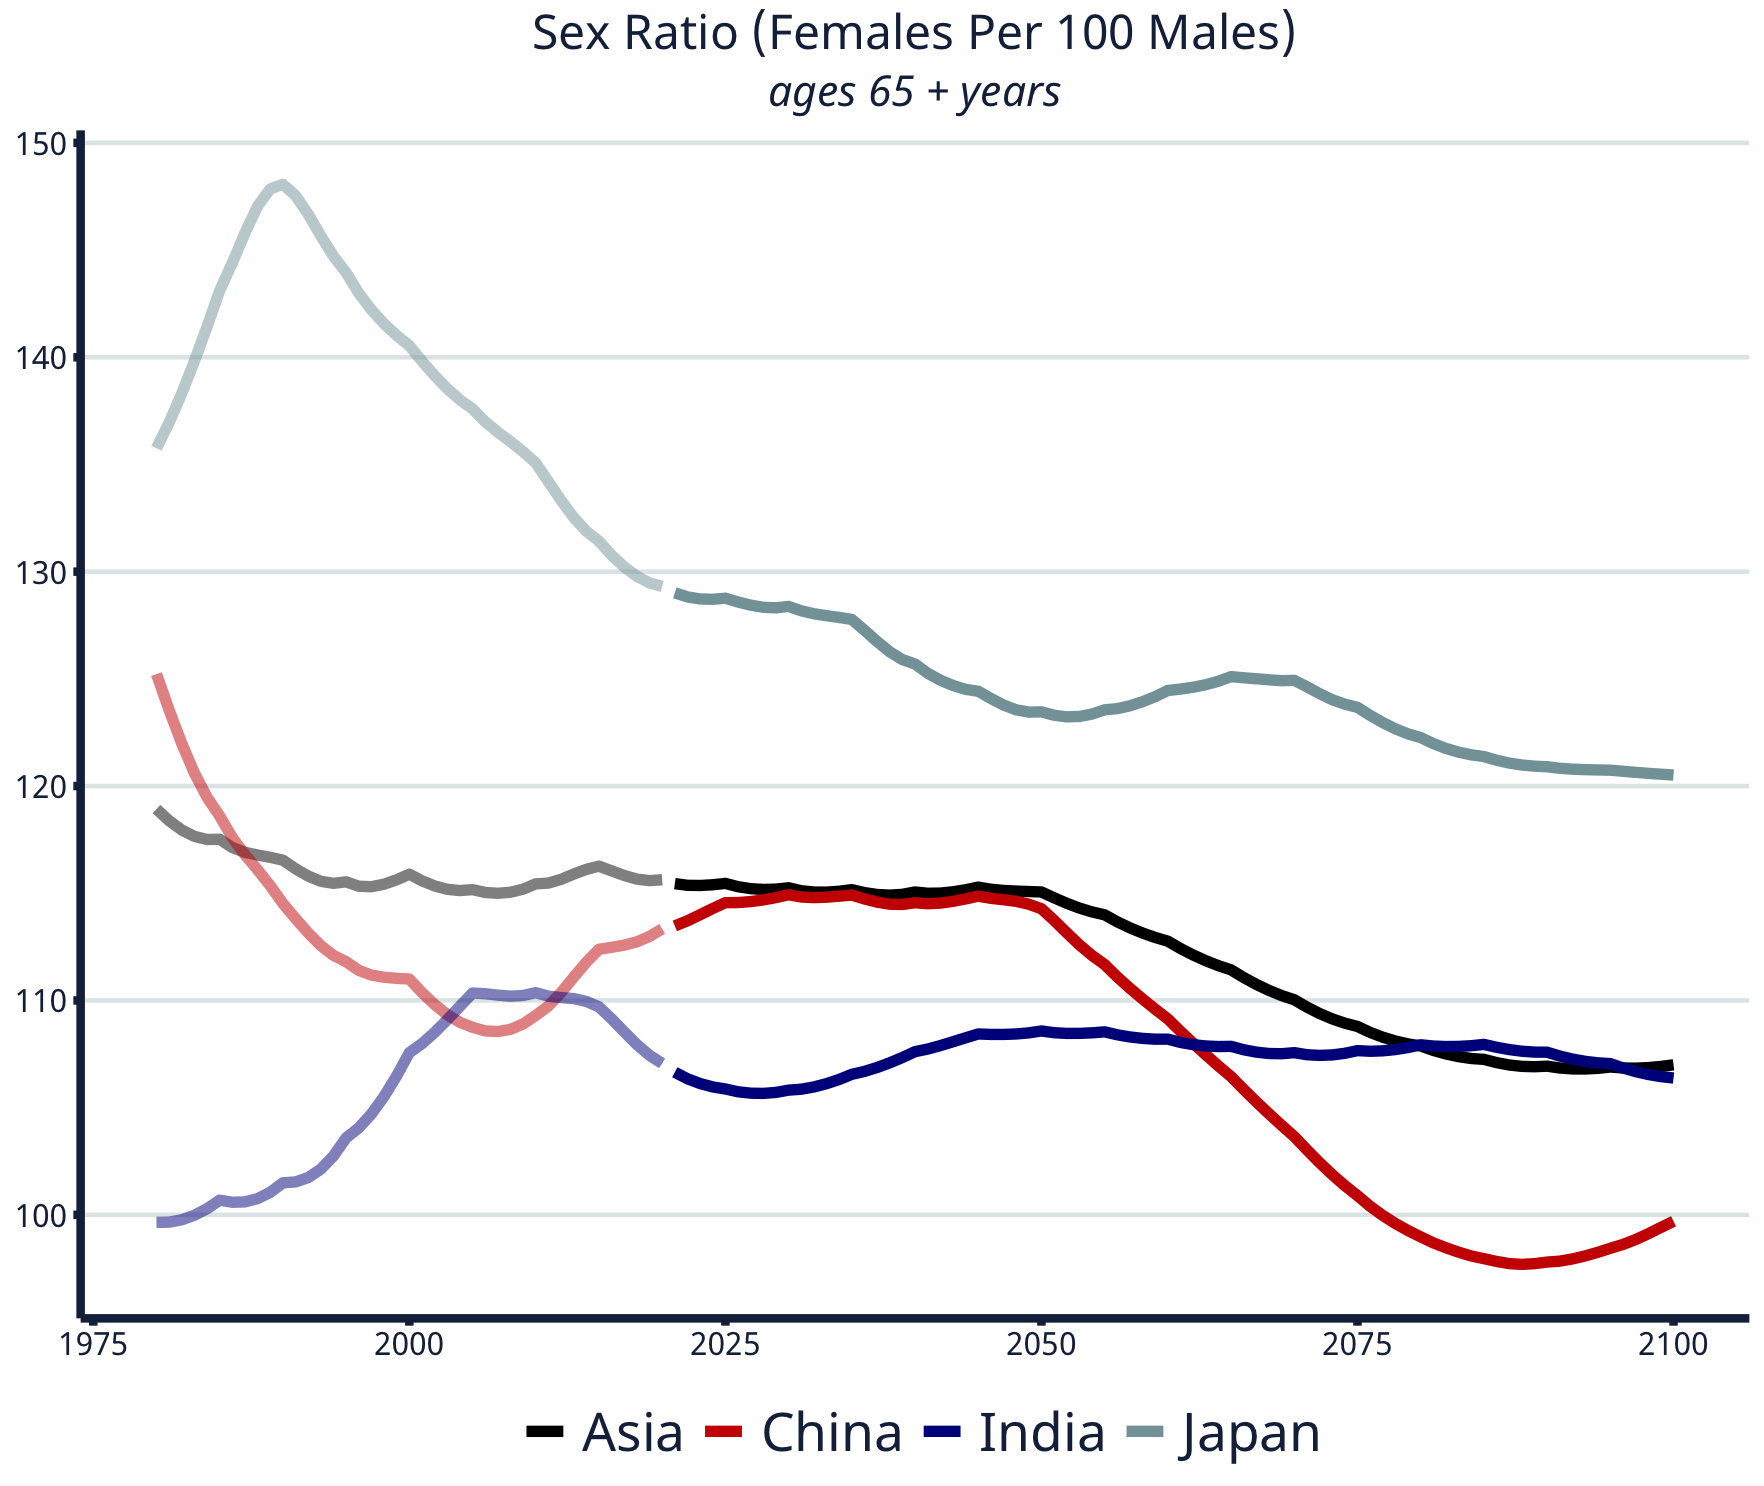
Data: Department of Economic and Social Affairs, United Nations
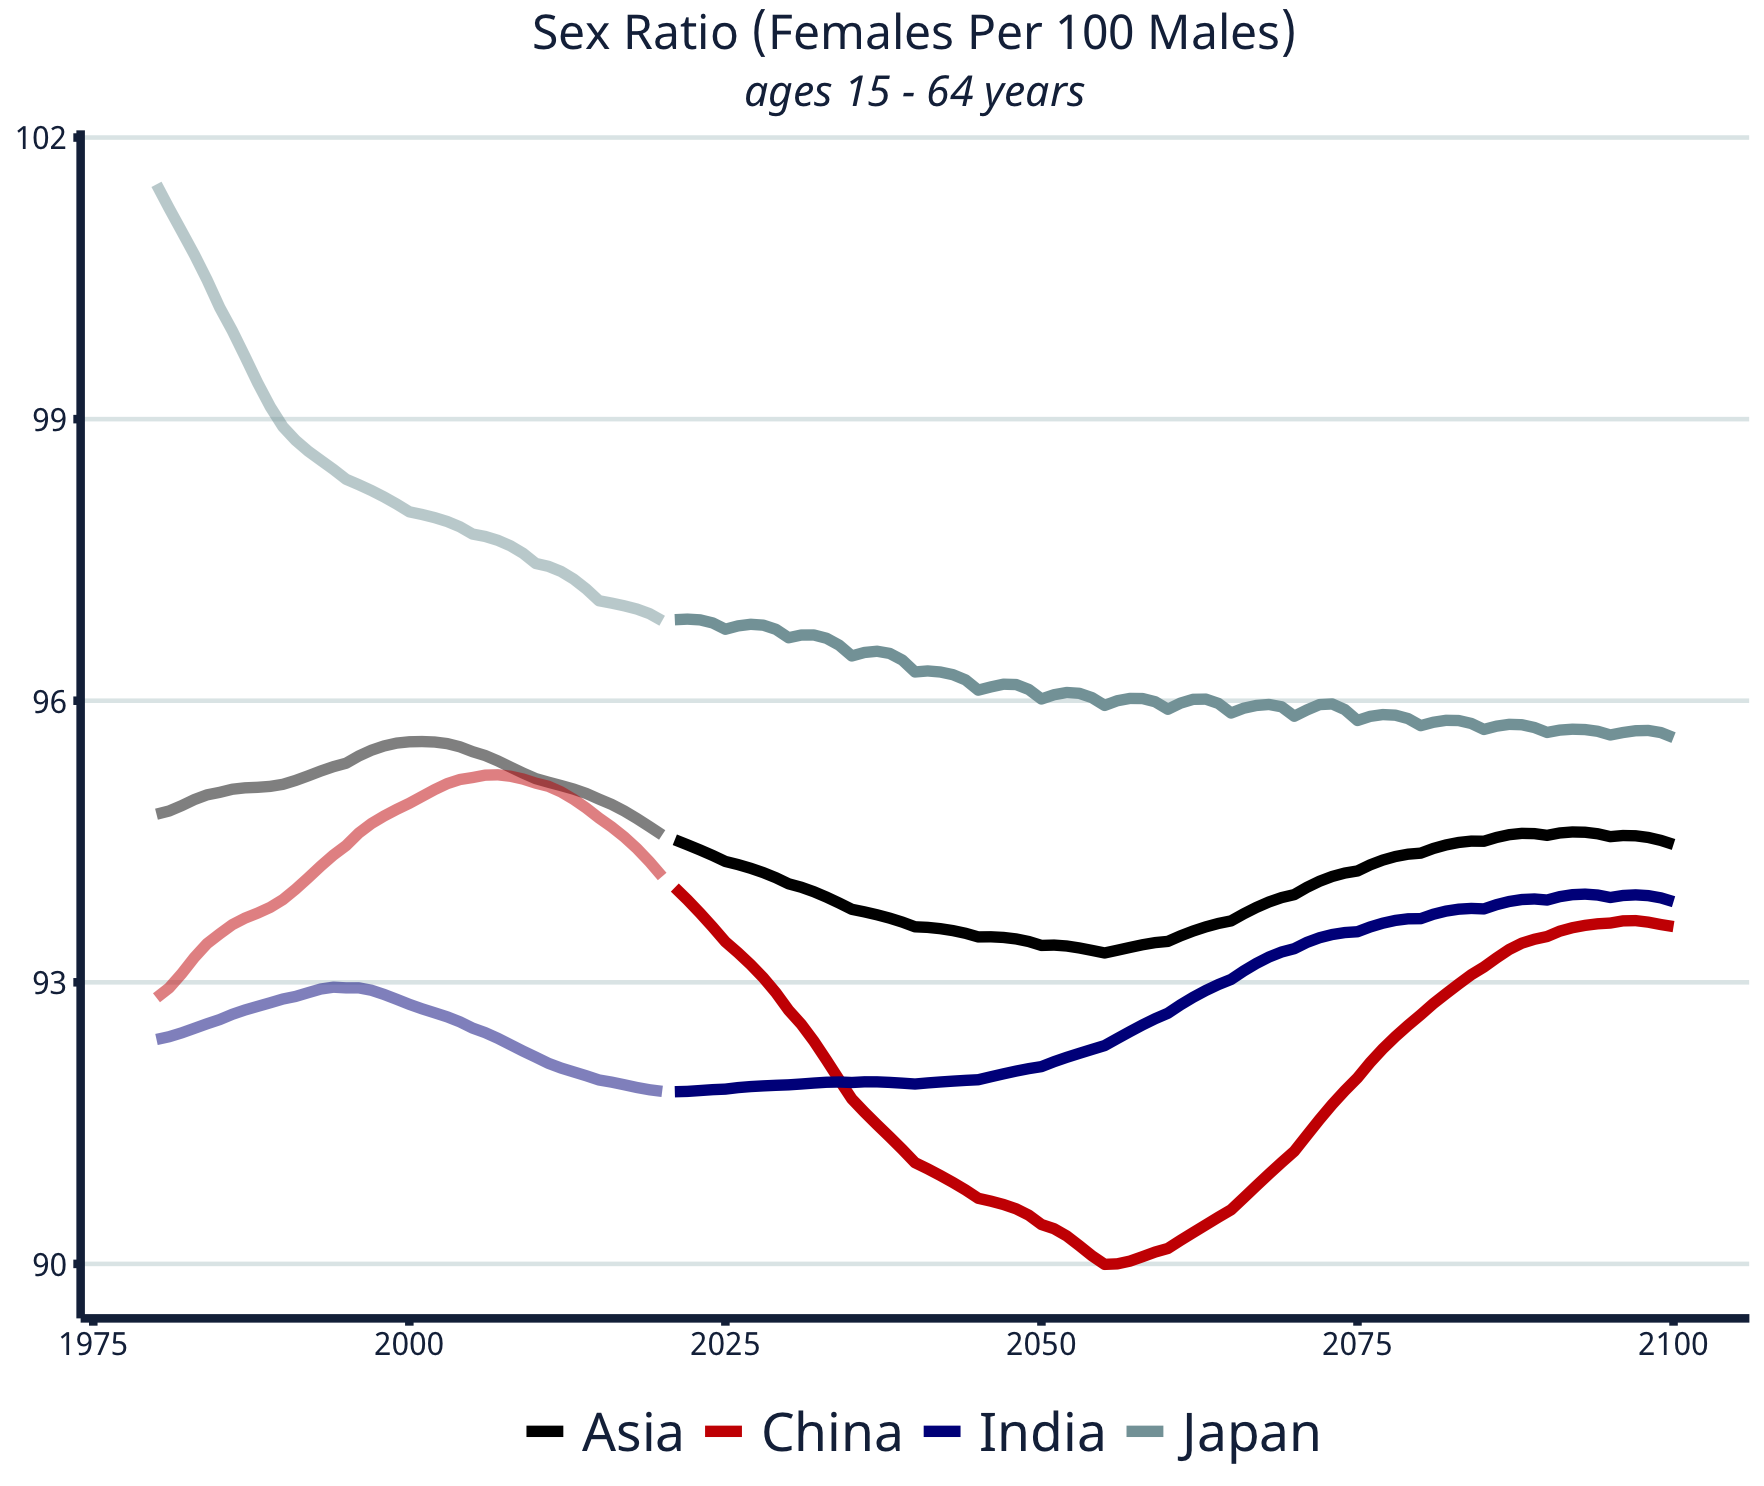
Data: Department of Economic and Social Affairs, United Nations
Data: Department of Economic and Social Affairs, United Nations
By the turn of this century, Japan will have the highest number of females per 100 men, larger than not just the corresponding figures for China and India, but also the projected figure for Asia as a whole.
Old-age (65 plus) and young-age (0 – 14 years) dependency ratios are defined as the ratios of 65 plus and under 14 citizens, respectively, to the total working age population (15 – 64 years).
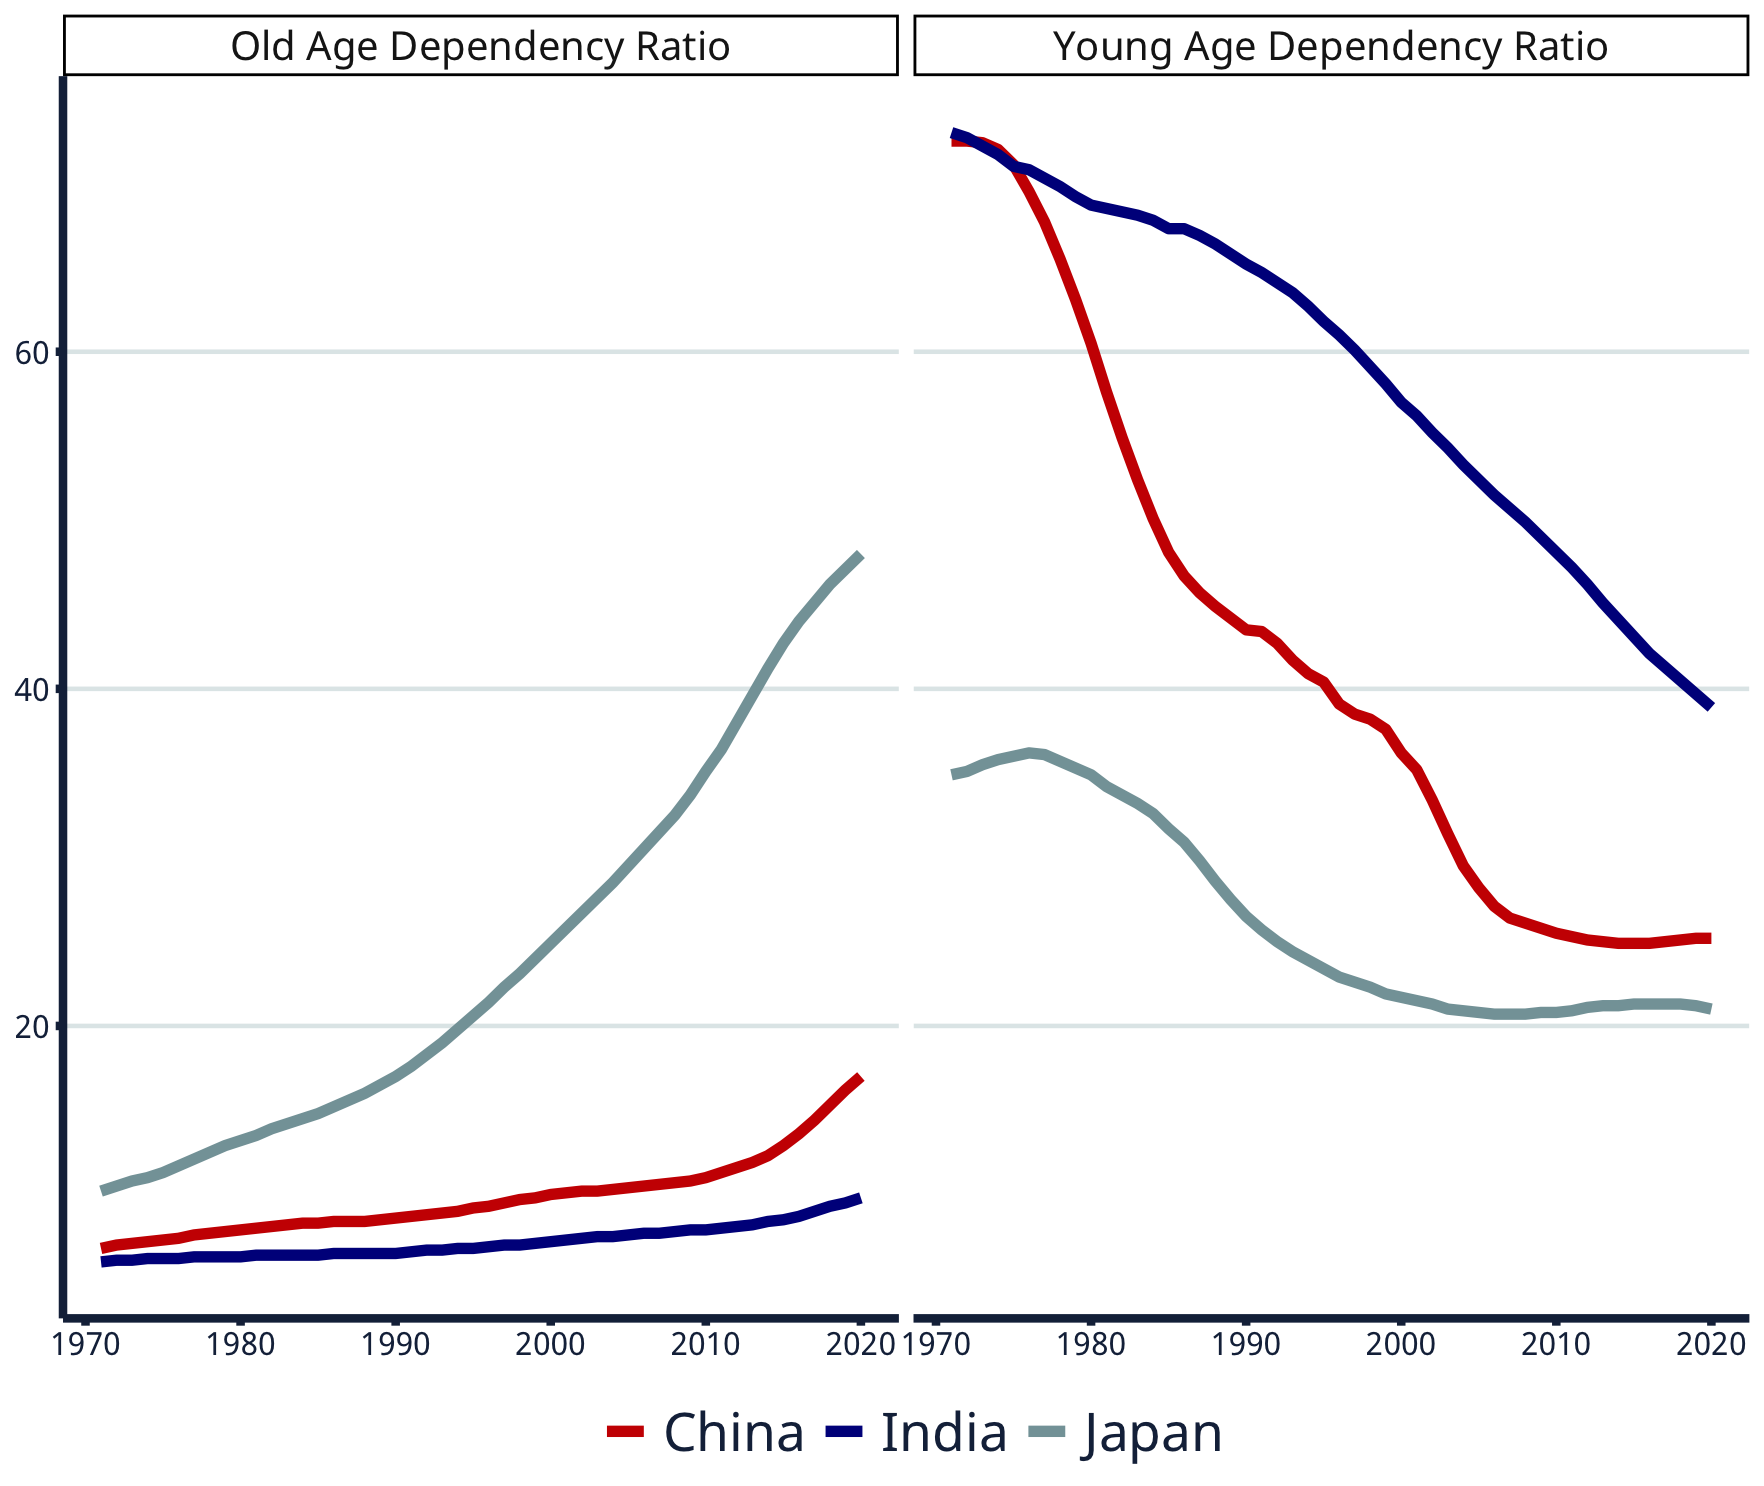
Age dependency ratio (as percent of working-age population). Data: World Bank
In 2050, India will be better placed than both China and Japan when it comes to working age population and median age.
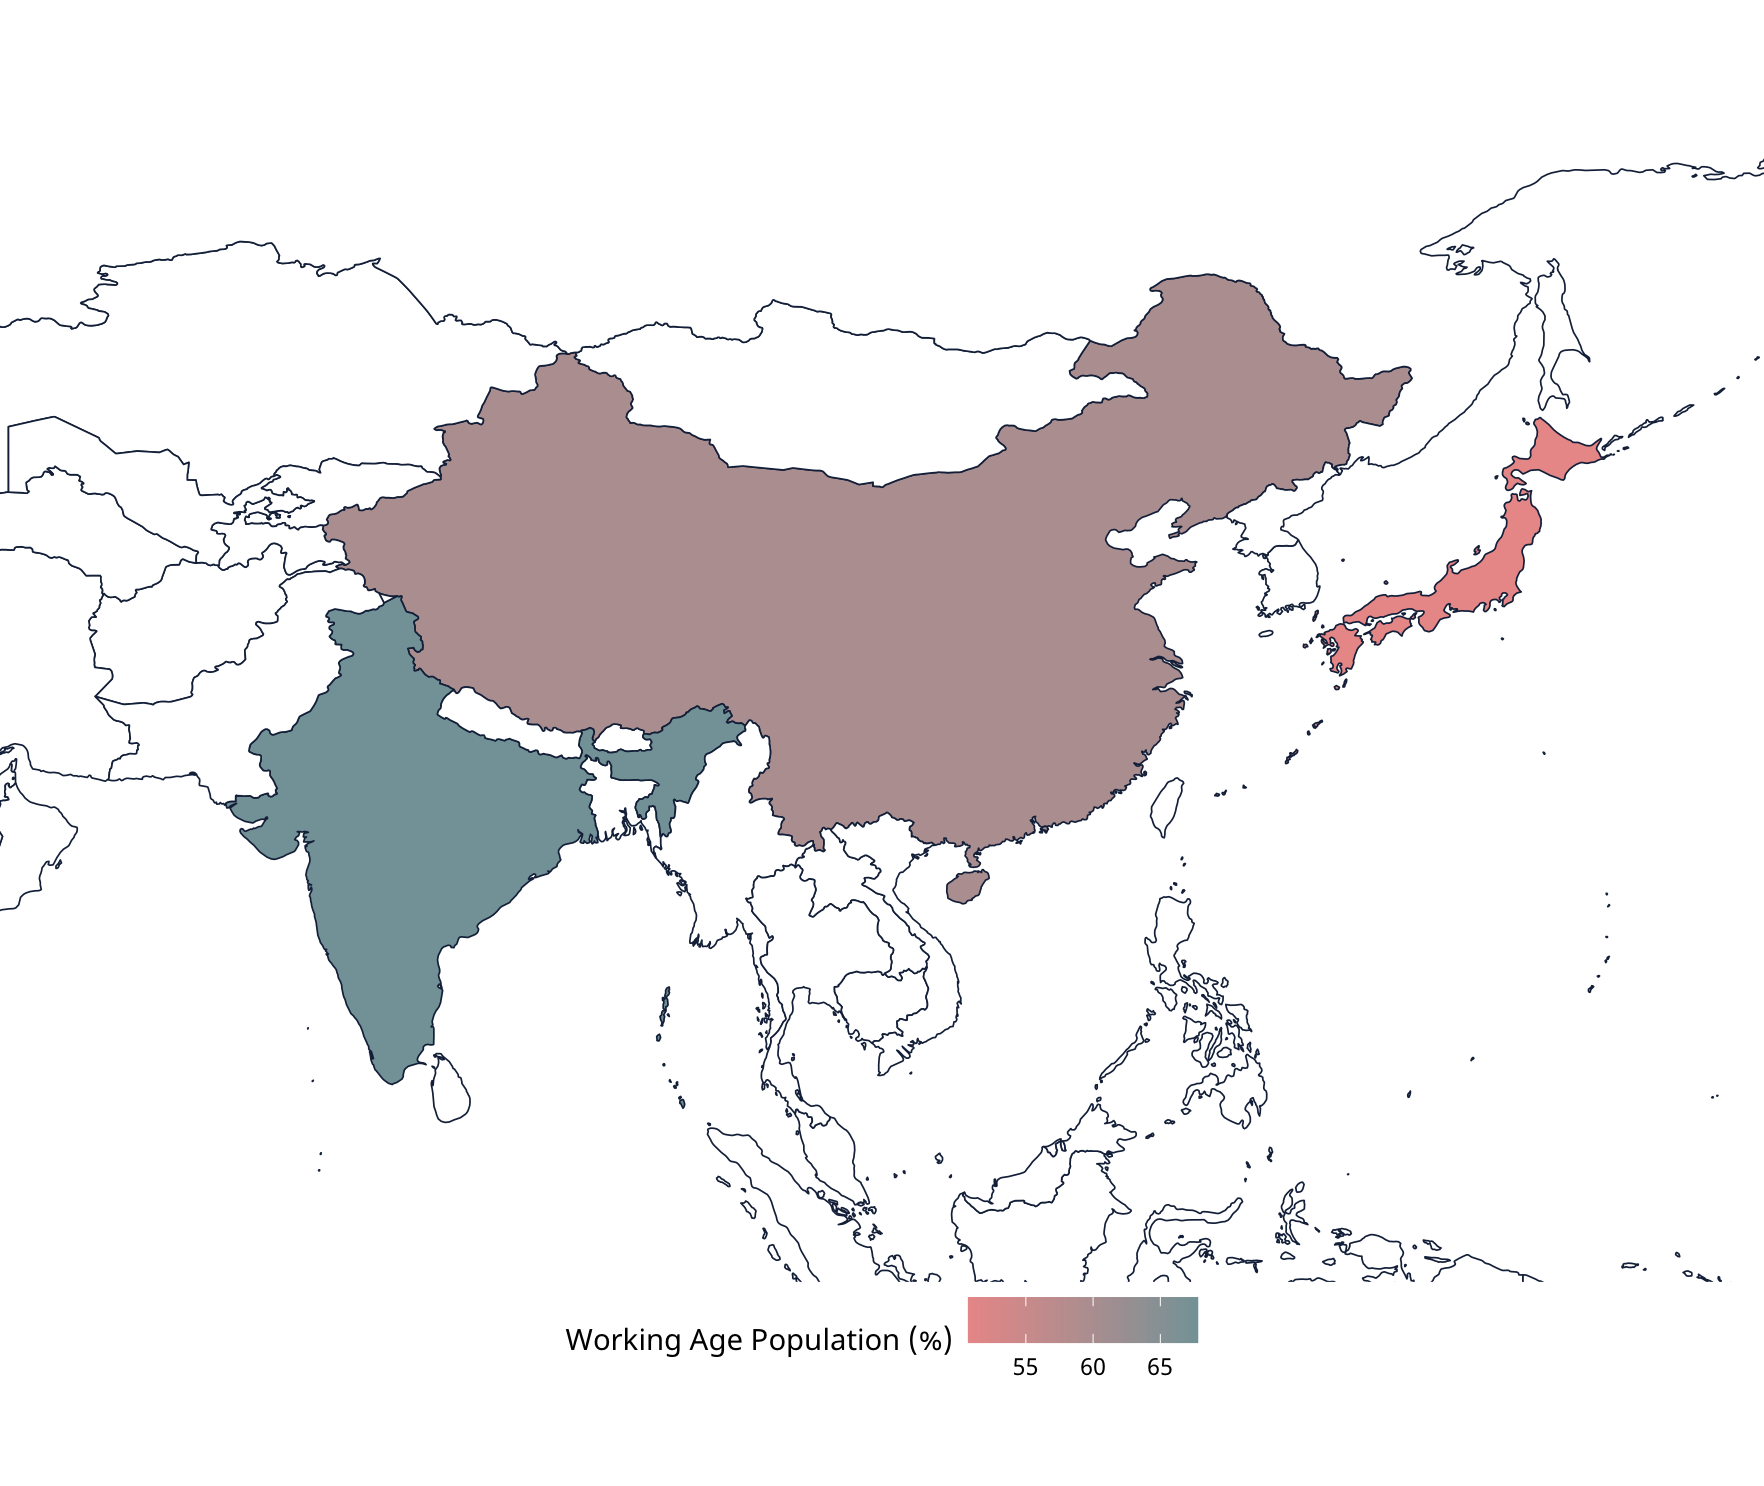
Proportion of working-age population projected in 2050. Data: Department of Economic and Social Affairs, United Nations
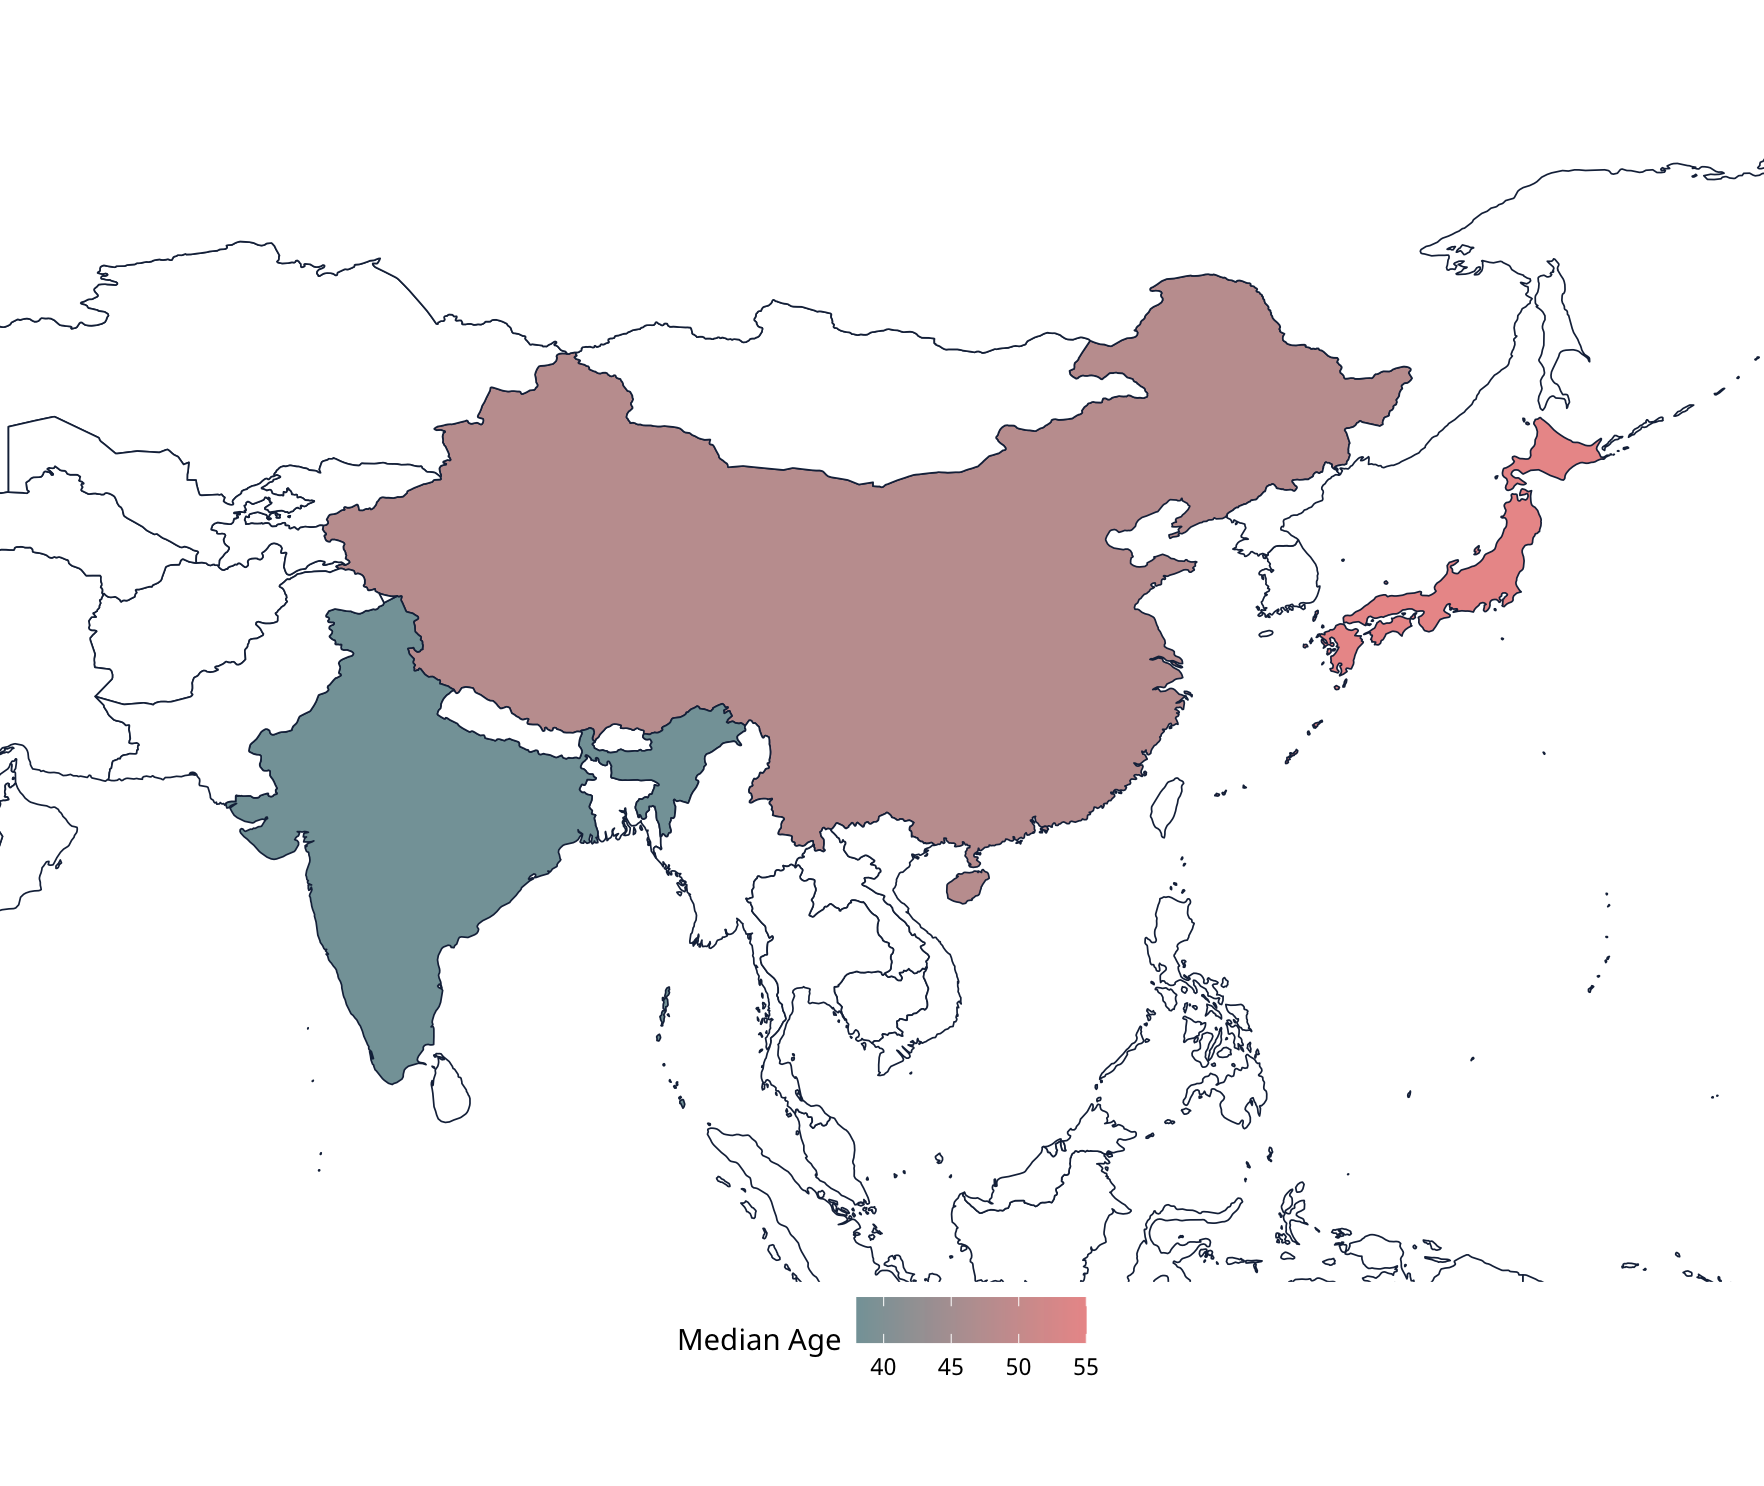
Median age of population projected in 2050. Data: Department of Economic and Social Affairs, United Nations
The preceding was an excerpt from the latest DRI Trendlines “Demography’s Long Shadow: Population and Prosperity in China, India, Japan.” Access the full report here.